Hello, world!
Welcome to Datasci for Lang & Mind
1 What is data science?
Data are descriptions of the world around us, collected through observation and stored on computers. Computers enable us to infer properties of the world from these descriptions. Data science is the discipline of drawing conclusions from data using computation.
– Computational and Inferential Thinking: The Foundations of Data Science
Data science is about making decisions based on incomplete information. This concept is not new – brains (especially human brains!) love doing this. To illustrate, what do you see in the following image?

Did you see a gray triangle on top of three circles? Most people do! But it turns out that your brain is filling in the gaps, inferring the presence of a triangle from the partial information available in the black circles 2.
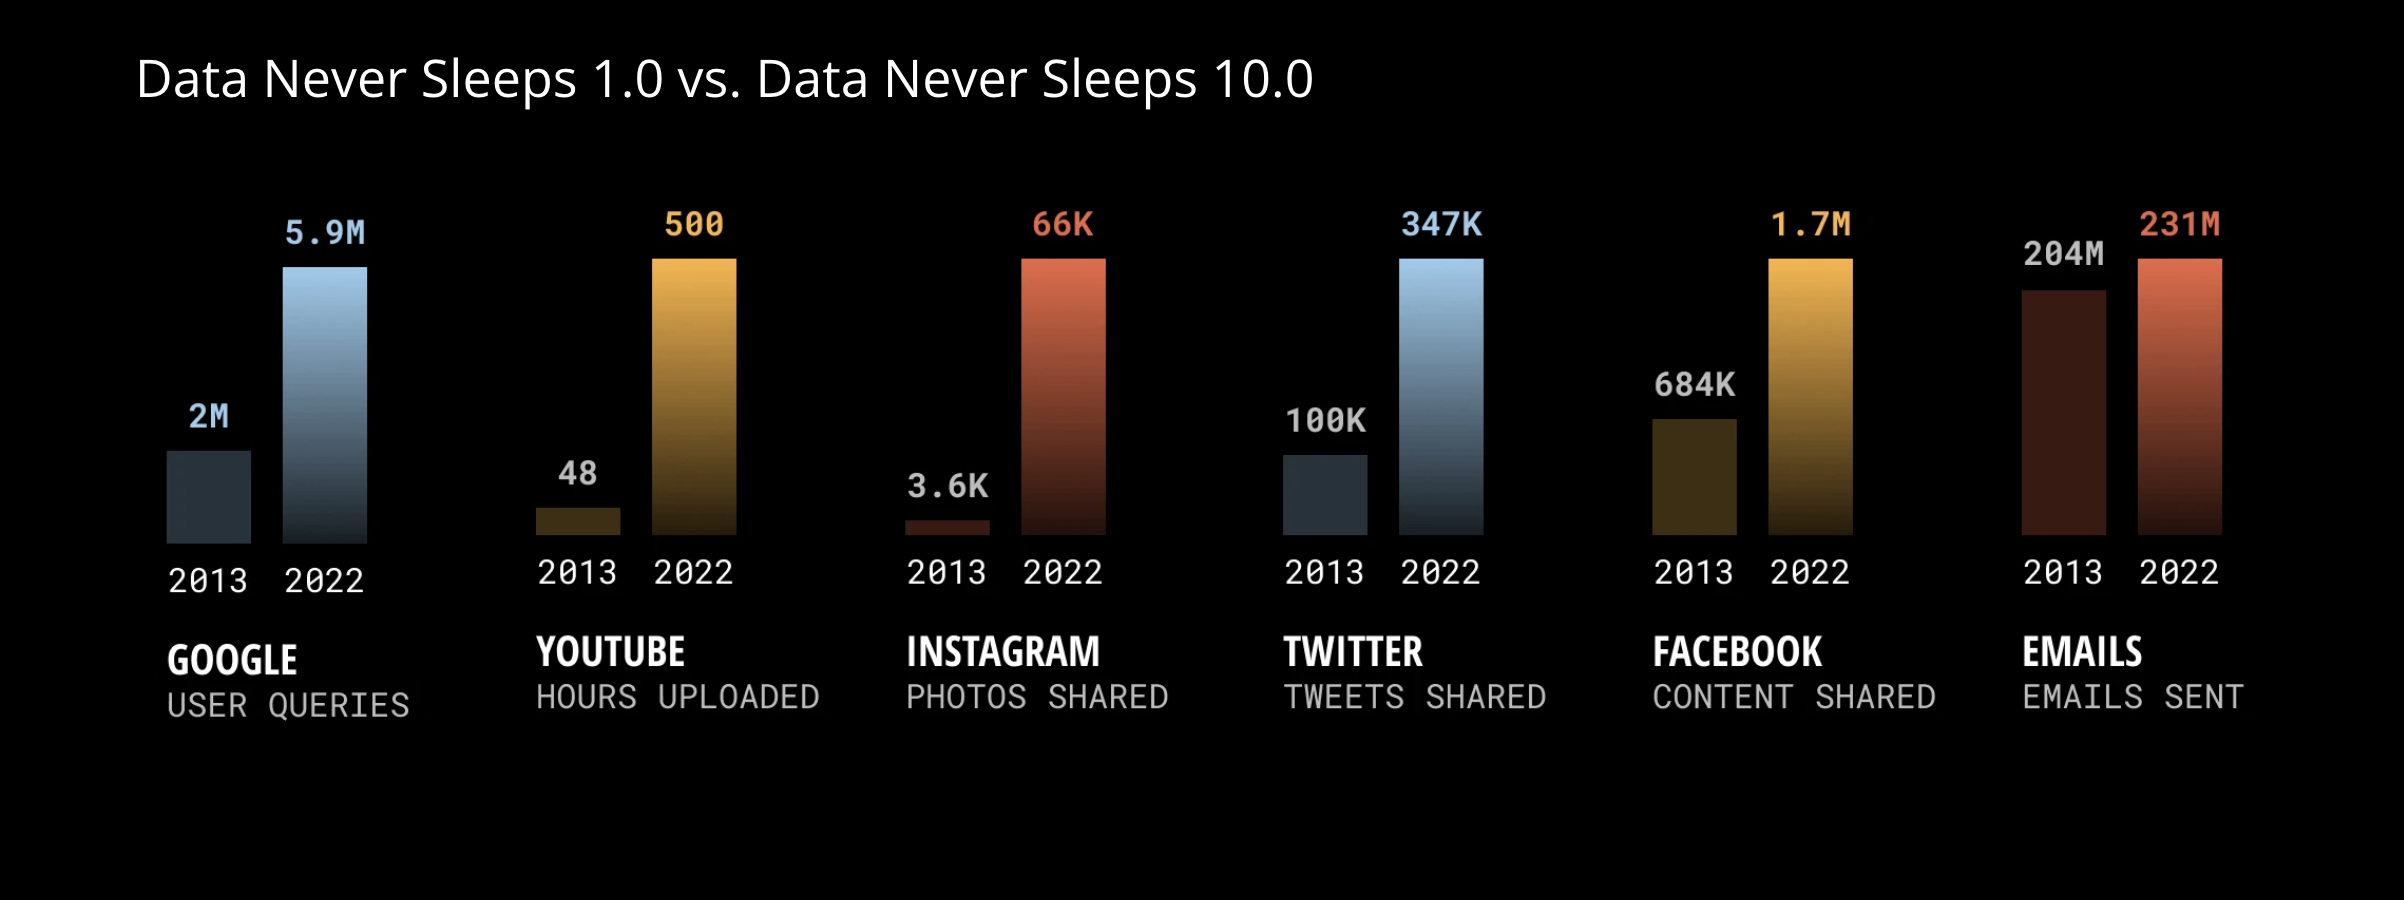
While the underlying concept is not new, the computational tools we use are relatively new. And we have a lot more data!
2 Data science workflow
The folks who wrote R for Data Science proposed the following data science workflow:
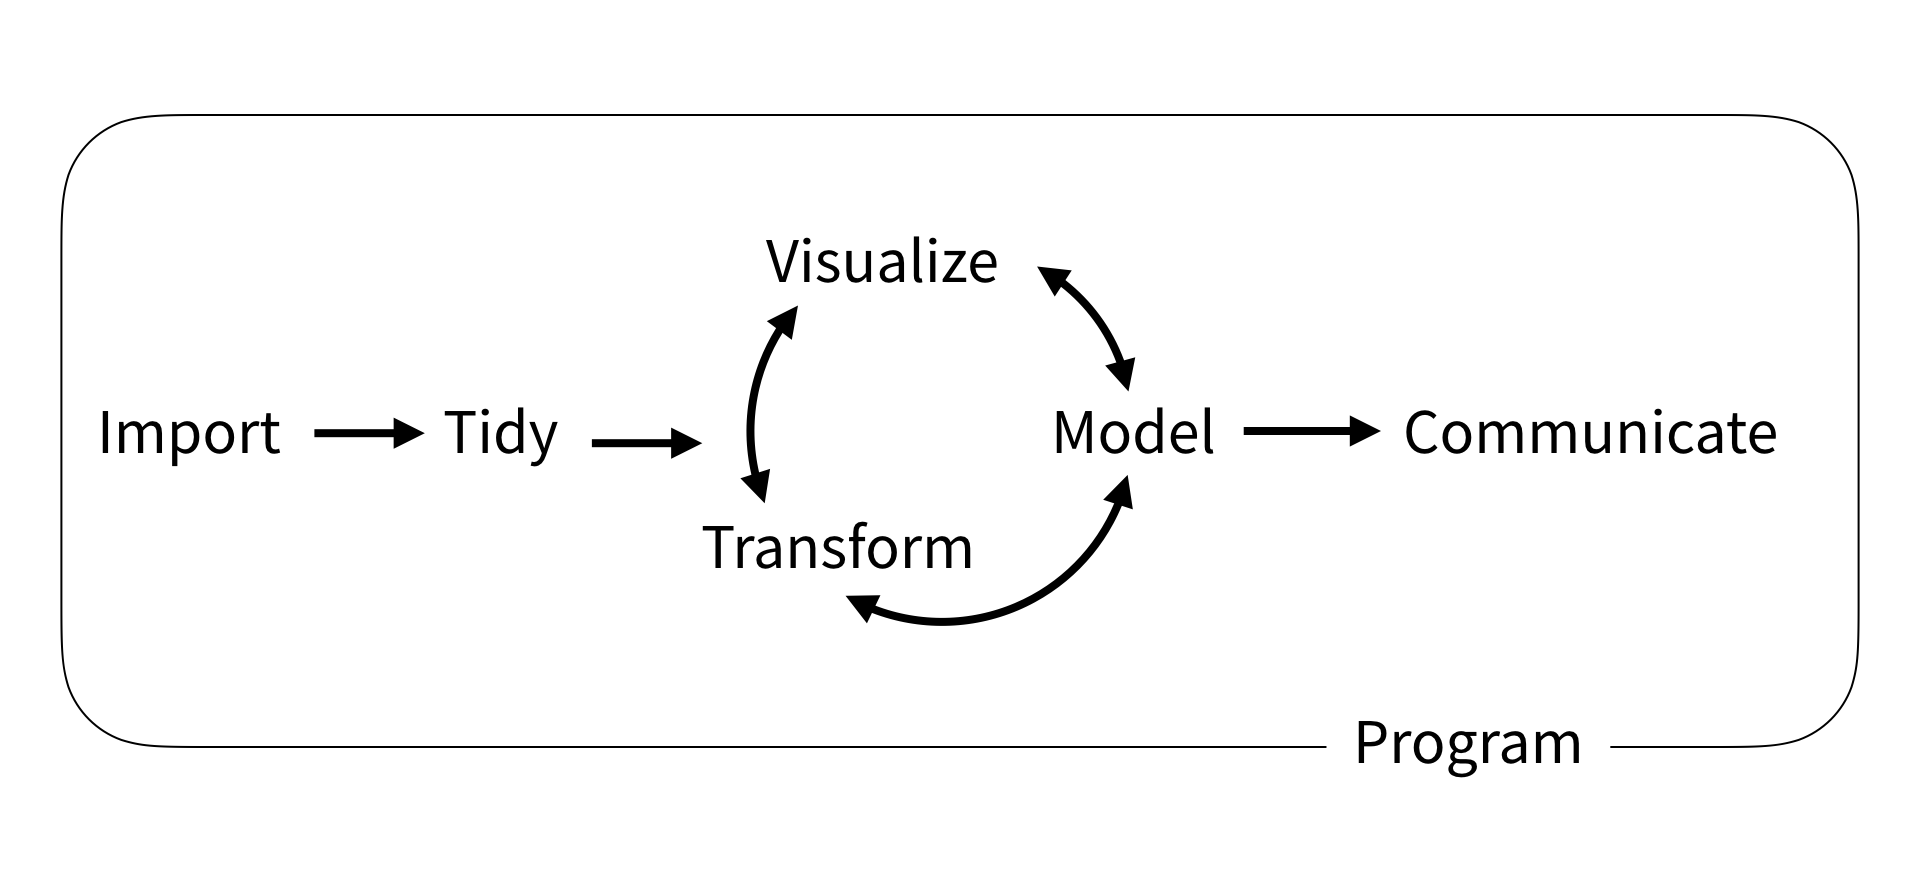
Let’s unpack what these mean briefly:
Import: gather data from a variety of sources, which can include structured data (like databases and spreadsheets) and unstructured data (like text, images, and videos).
Tidy and Transform: The raw data we import is often messy. Data scientists clean and preprocess the data, which involves removing errors, handling missing values, and transforming data into a suitable format for analysis.
Visualize (exploratory data analysis) visualize and summarize data to identify patterns, form hypotheses, select appropriate models, and guide further analysis.
Model: Using statistical methods, machine learning algorithms, and other computational techniques, data scientists build models to understand underlying patterns in the data. Models are tested using validation techniques to ensure their accuracy and reliability. Then data scientists use them to draw meaningful conclusions, like predictions about the future or inferences about populuation.
Communicate: Finally, a crucial part of data science is communicating findings clearly and effectively, whatever your purpose (academic, industry, or the public!)
Program: Surrounding all these is programming, since the computational tools are what make these possible!
Data science has applications in many fields far beyond language and the mind. It allows us to make data-driven decisions, solve complex problems, and uncover hidden insights that might not be apparent through other methods.
3 Overview of the course
We will spend the first few weeks getting comfortable programming in R, including some useful skills for data science:
- R basics
- Data importing
- Data visualization
- Data wrangling
Then, we will spend the next several weeks building a foundation in basic statistics and model building:
- Probability distributions
- Sampling variability
- Hypothesis testing
- Model specification
- Model fitting
- Model accuracy
- Model reliability
Finally we will cover a selection of more advanced topics that are often applied in language and mind fields, with a focus on basic understanding:
- Classification
- Feature engineering (preprocessing)
- Inference for regression
- Mixed-effect models
4 Syllabus, briefly
Each week will include two lectures and a lab:
- Lectures are on Tuesdays and Thursdays at 10:15am and will be a mix of conceptual overviews and R tutorials. It is a good idea to bring your laptop so you can follow along and try stuff in R!
- Lab is on Thursday or Friday and will consist of (ungraded) practice problems and concept review with TAs. You may attend any lab section that works for your schedule.
There are 10 graded assessments:
- 6 Problem sets in which you will be asked to apply your newly aquired R programming skills.
- 4 Quizzes in which you will be tested on your understanding of lecture concepts.
There are a few policies to take note of:
- Missed quizzes cannot be made up except in cases of genuine conflict or emergency (documentation and course action notice required)
- You may request an extension on any problem set of up to 3 days. But extensions beyond 3 days will not be granted (because delying solutions will negative impact other students).
- You may submit any missed quiz or problem set by the end of the semester for half-credit (50%).
5 Why R?
With many programming languages available for data science (e.g. R, Python, Julia, MATLAB), why use R?
- Built for stats, specifically
- Makes nice visualizations
- Lots of people are doing it, especially in academia
- Easier for beginners to understand
- Free and open source (though so are Python and Julia, MATLAB costs $)
If you are interested, here is a math professor’s take on the differences between Python, Julia, and MATLAB. Note that although they’re optimized for different things, they are all great and the technical skills and conceptual knowledge you gain in this course will transfer to other languages.
6 Google Colab
There are many ways to program with R. Some popular options include:
- R Studio
- Jupyter
- VS Code
- and even simply the command line/terminal
Google Colab is a cloud-based Jupyter notebook that allows you to write, execute, and share code like a google doc. We use Google Colab because it’s simple and accessible to everyone. You can start programming right away, no setup required! Google Colab officially supports Python, but secretly supports R (and Julia, too!)
New R notebook:
- colab (r kernel) - use this link to start a new R notebook
File > New notebookerror, Python!name 'x' is not defined
Cell types:
+ Code- write and execute code+ Text- write text blocks in markdown
Left sidebar:
Table of contents- outline from text headingsFind and replace- find and/or replaceFiles- upload files to cloud session
Frequently used menu options:
File > Locate in Drive- where in your Google Drive?File > Save- savesFile > Revision history- history of changes you madeFile > Download > Download .ipynb- used to submit assignments!File > Print- printsRuntime > Run all- run all cellsRuntime > Run before- run all cells before current active cellRuntime > Restart and run all- restart runtime, then run all
Frequently used keyboard shortcuts:
Cmd/Ctrl+S- saveCmd/Ctrl+Enter- run focused cellCmd/Ctrl+Shift+A- select all cellsCmd/Ctrl+/- comment/uncomment selectionCmd/Ctrl+]- increase indentCmd/Ctrl+[- decrease indent
7 Further reading and references
Recommended reading:
- Ch 1 Data Science from Computational and Inferential Thinking: The Foundations of Data Science (just skip the bits about using Python, since we are using R)
- Ch 1 Introduction in R for Data Science
- Ch 1 Software for Modeling in Tidy Modeling with R
Other references:
- Matlab vs. Julia vs. Python from blog post by Toby Driscoll