Lab 4: Sampling distribution
Not graded, just practice
Practice your new stats skills with these practice exam questions! Best to open a fresh Google Colab notebook and test things out! Refer to the study guide to find answers as well.
Tip
More than one answer may be correct!
If you would like to practice with a set of data, you can import the following dataset with read_csv:
# brain volumes simulated from Ritchie et al
"http://kathrynschuler.com/datasets/brain_volume.csv"
1 Descriptive statistics
- Which of the following is the best choice to visualize the frequency distribution of a set of data? Choose one.
- Which of the following would summarize the central tendency of a set of data? Choose all that apply.
- Which of the following would summarize the spread of a set of data? Choose all that apply
- Which of the following are paramteric statistics?
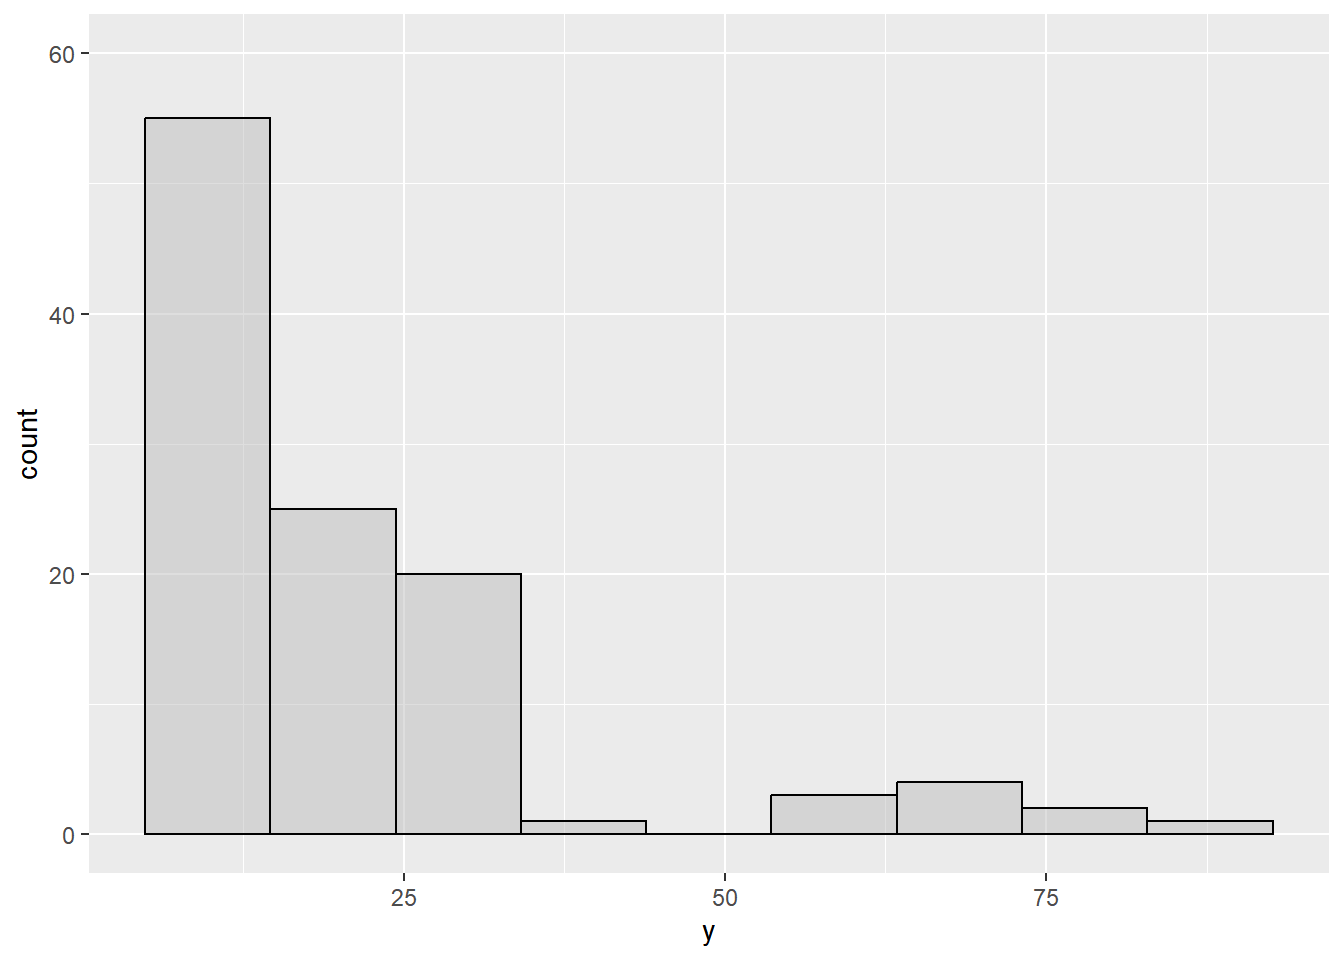
- Given the following figure, which summary statistics would best describe these data?
Given the following code, which of the following would fill in the blank to return the value below which 20% of the data fall.
data %>% summarise(
    lower = quantile(y, ________)
)
2 Probability distributions
- Write code to generate 200 data points, sampled from a gaussian distribution with a mean of 0 and a standard deviation of 1.
Answer
rnorm(200, mean = 0, sd = 1)- Suppose you sampled 500 data points from a uniform distribution and stored the result in
data. Then, you use the following code to compute the summary stats. What is the height of the probability density function at a value of 5?
data %>% summarise(
    n = n(),
    mean = mean(y),
    sd = sd(y),
    lower = quantile(y, 0),
    upper = quantile(y, 1)
)
# A tibble: 1 × 5
n mean sd lower upper
<int> <dbl> <dbl> <dbl> <dbl>
1 500 7.58 1.43 5.09 9.99- Suppose your data is normally distributed and has a mean of 25 and a standard deviation of 5. What is the probability a random value drawn from your dataset will be less than 20? Select the closest value.
3 Sampling variability
- True or false, the
parameteris the mean of the population and theparameter estimateis the mean of your sample?
- What do we call the probability distribution of the values our parameter estimate can take on?
- Suppose we want to quantify the spread of the sampling distribution. What method could we choose? Choose all that apply.
- For a typical experiment, how many samples from the population is practical for us to take? Enter a number.
4 Bootstrapping
- True or false, when we generate the bootstrap sampling distribution, we sample our original sample with replacement.
- Suppose we want to generate the bootstrap sampling distribution for the mean of set of data,
data, with one variable:reaction_time. Write code that uses theinferpackage to accomplish this, generating 1000 samples.
Answer
data %>%
    specify(response = reaction_time) %>%
    generate(reps = 1000, type = "bootstrap") %>%
calculate(stat = "mean")- Suppose we store our bootstrap sampling distribution from part b in a variable called
bootstrap_distribution. Which two arguments should we add to the code below to compute the 68% confidence interval and assign it to the valueci?
ci <- bootstrap_distribution %>%
get_confidence_interval(______, ________)- Suppose we store our bootstrap sampling distribution in
bootstrap_distributionand we want to visualize the confidence interval we just computed in c. Which of the following could we add to the code below? Choose all that apply.
bootstrap_distribution %>%
    visualize() +
    _____________