[,1] [,2] [,3]
[1,] 3 6 9
[2,] 4 7 10
[3,] 5 8 11Problem set 1
due Sunday, September 10, 2023 at 11:59pm
Estimated time: 6 hours
Allocate about 1 hour per problem, though some will take longer than others. You may need more time if programming is completely new to you, or less if you have some experience already.
- Instructions
-
Upload your
.ipynbnotebook to gradescope by 11:59pm on the due date.
- Note that each problem will be graded according to this rubric. Solutions that include packages or functions not covered in this course will recieve a score no higher than 2.
- You may collaborate with any of your classmates, but you must write your own code/solutions, understand all parts of the problem, and name your collaborators.
- You should also cite any outside sources you consulted, like Stack Overflow or ChatGPT, with a comment near the relevant lines of code (see example below). Recycled code that has not been cited will be considered plagerism and receive a zero.
# code here was inspired by user2554330 on stack overflow:
# https://stackoverflow.com/questions/69091812/is-everything-a-vector-in-r
Problem 0
Create a new colab R notebook. Add a text block that includes the title “Problem set 1”, your name, and the date. Add a text block with a heading for each problem in the set. As you work through the problem set, include your code/solutions below the appropriate heading. Finally, load the tidyverse package under your heading for problem 0.
Problem 1
Suppose you record how many words your quiet roommate says to you each day for a week. Convert the vector given below from strings to doubles using coercion and store it as words_spoken. Use R’s built-in functions to compute the total number of words your roommate said that week, the average number of words spoken per day, and the maximum number of words spoken on a single day. Store the results in a tibble. Perform a comparison operation on the words_spoken vector to determine whether each day’s words were above the average. Finally, use subsetting to extract the days where the number of words were in the single digits.
words_spoken_stringy <- c("5", "3", "20"," 0", "4", "35", "1")Problem 2
Create the matrix given below. Use one of R’s built-in functions to append a new row to the matrix made up of all 1s. Multiply every number in the new matrix by 5. Then use subsetting to return the second and fourth row of values in the final matrix.
Problem 3
Create a data frame that looks like the one below. Return the structure of the dataframe with str(). Use subsetting to select all columns that were indicated as doubles. Compute the mean of each column in the subset dataframe using map_*() and convert the output to a tibble (use the pipe!).
  age height  major score firstgen
1  30     65 cogsci   100     TRUE
2  45     66   ling    75    FALSE
3  81     72  psych    88     TRUE
4  27     59   ling    97    FALSE
Problem 4
Read the documentation for the emo package. Install and load the package. Then create a character vector including 8 of your favorite emojis by their keyword (see the docs for a list). Finally, use the package’s emo::ji() function in conjunction with map_*() to print all 8 emojis with one line of code. Combine this output with your keyword vector in a tibble.
Problem 5
Suppose you extend your experiment: you decide to record the number of words your quiet roommate says to you every day for the entire semester. Import the file below from the given url, ensuring that week is an integer vector, words spoken is a double, and all column names are valid variable names in R. Take care to use the approaches we discussed in lecture to identify and handle any issues. Use glimpse to show the resulting tibble. Finally, use these data to recreate (as faithfully as possible) the figure below.
"https://kathrynschuler.com/datasets/quiet_roommate.csv"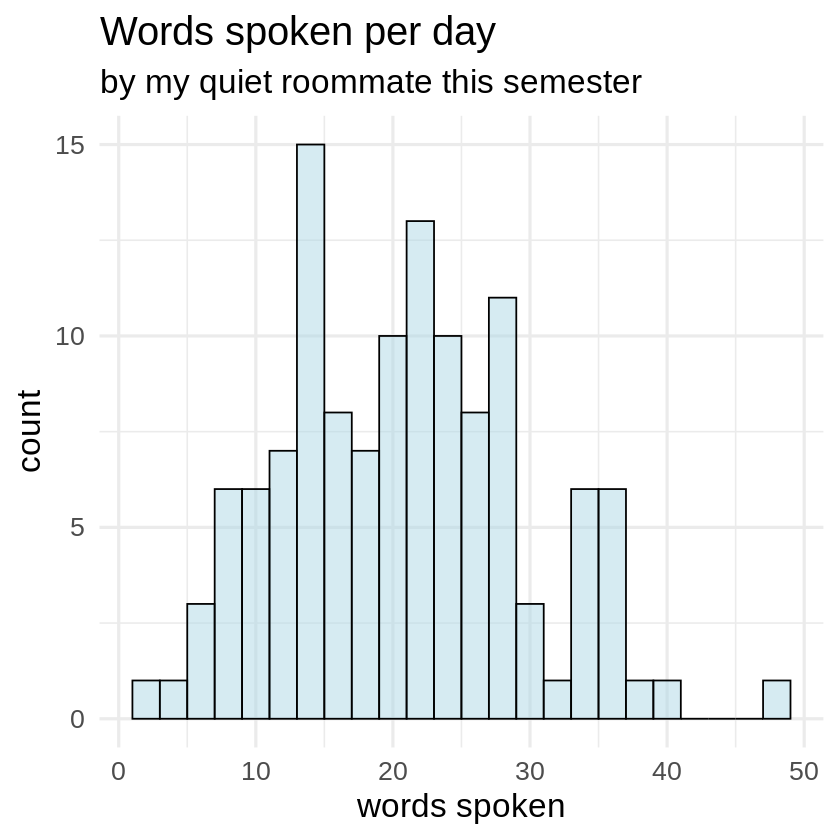
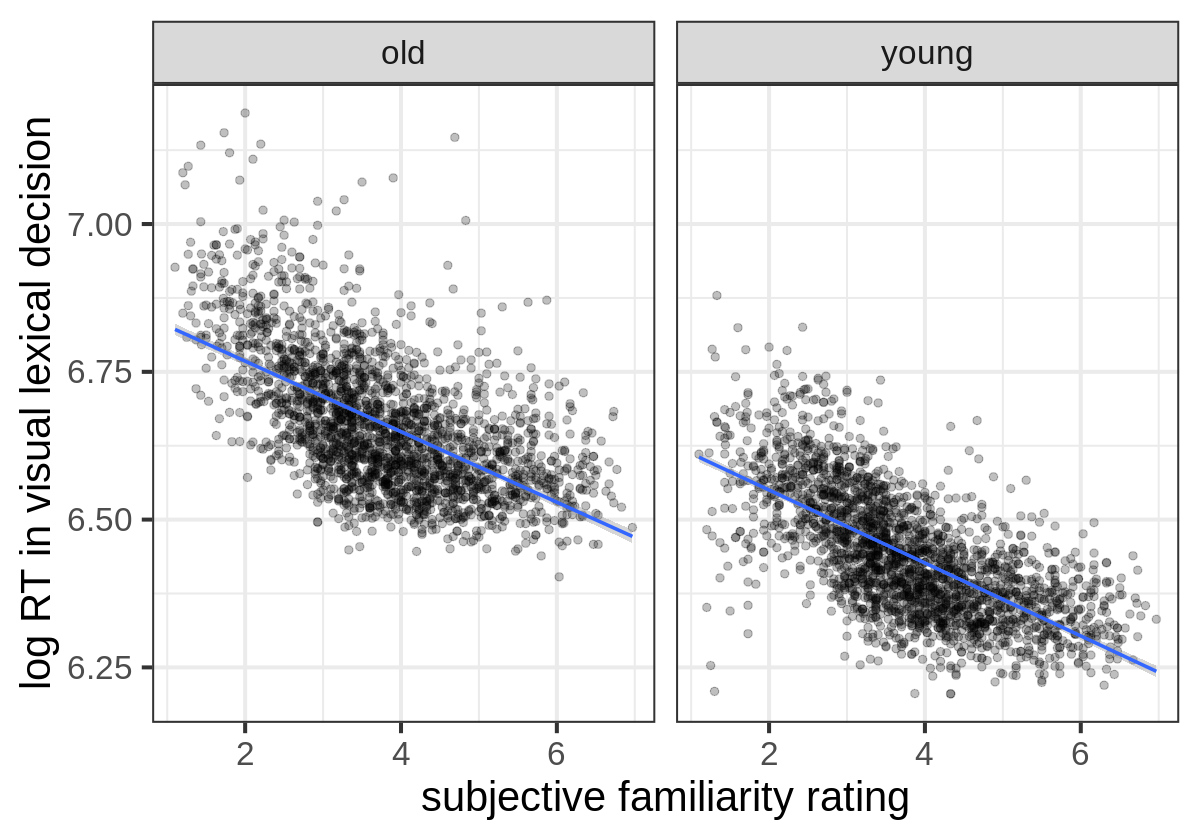
Problem 6
Problem 6 makes use of the english dataset in the languageR package. From the documentation:
This data set gives mean visual lexical decision latencies and word naming latencies to 2284 monomorphemic English nouns and verbs, averaged for old and young subjects, with various predictor variables.
Install and load the languageR library. Convert the english dataset to a tibble, then use glimpse to show the result. Finally, use the RTlexdec, Familiarity, and AgeSubjects columns to recreate (as faithfully as possible) the figure below.