# A tibble: 4 × 3
x y z
<int> <int> <int>
1 1 5 9
2 2 6 10
3 3 7 11
4 4 8 12Lab 3: Data wrangling
Not graded, just practice
Materials from lab
1 Tidy
1.1 Tidyverse
What is the relationship between tidyverse and readr?
In the tidyverse, what does “tidy data” refer to?
What is the purpose of the
purrrpackage?What is the primary purpose of the
readrpackage?Which of the following returned this message?
── Attaching core tidyverse packages ──────────────────────── tidyverse 2.0.0 ──
✔ dplyr     1.1.2     ✔ readr     2.1.4
✔ forcats   1.0.0     ✔ stringr   1.5.0
✔ ggplot2   3.5.0     ✔ tibble    3.2.1
✔ lubridate 1.9.2     ✔ tidyr     1.3.0
✔ purrr     1.0.2
── Conflicts ────────────────────────────────────────── tidyverse_conflicts() ──
✖ dplyr::filter() masks stats::filter()
✖ dplyr::lag()    masks stats::lag()
ℹ Use the conflicted package (<http://conflicted.r-lib.org/>) to force all conflicts to become errors
1.2 purrr
Suppose we have the following tibble, stored with the variable df.
What will
map(df, mean)return?Suppose we wanted to coerce each column in the previous tibble to the data type
doublewith one line of code. Fill in the two arguments tomapthat would accomplish this:
- map(, )
1.3 Tibbles
Suppose we run the following code block and create 3 tibbles:
# create tibble tib
tib <- tibble(x = 1:2, y = c("a", "b"))

# create tibble x
x <- tribble(
    ~x, ~y,
    2, 3,
    4, 5
)

# create tibble tibby
tibby <- tibble(
        age = c(1, 2, 3, 5),
        name = c("dory", "hazel", "graham", "joan"),
        alt_name = c("dolores", NA, NA, "joanie")
    )
What will
is.data.frame(tib)return?What will
typeof(tib)return?What will
is_tibble(x)return?Which of the following would convert a dataframe called
dfto a tibble? (note thatdfis not defined above, consider any artibrary dataframe)What will
tibby$areturn?
2 Import
The questions below refer to this dataset borrowed from R4DS and available at the url https://pos.it/r4ds-students-csv.
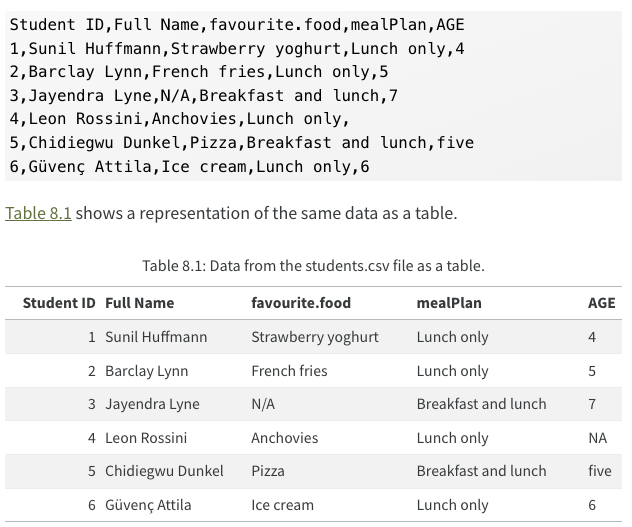
- What does the csv in
read_csv()stand for? Fill in the blank.
- separated values
Suppose we attempt to import the csv file given above with the code below. What will be the result?
data <- read_csv("https://pos.it/r4ds-students-csv", col_types = list(AGE = col_double()) )Suppose we import the dataset given above and name it
data. What willis.na(data[3,3])return?Suppose we import the dataset given above and name it
data. Which of the following would return the first column?True or false, assuming the same dataset the following code would rename the
Student IDcolumn tostudent_id?data %>% rename(student_id = `Student ID`)True or false, we can use a
read_*()function fromreadrto import a google sheet.
3 Transform
Which of the following
dplyrfunctions retuns a data frame?Which of the following
dplyrfunctions takes a number as their first argument?True or false, the following code blocks are equivalent.
# option 1
ratings %>% select(Word, Frequency) %>% glimpse()

# option 2
glimpse(select(ratings, Word, Frequency))
True or false, the following code options are equivalent
# option 1 ratings %>% select(Word:Class) %>% mutate(Length/Frequency, .after = Class) # option 2 ratings %>% select(Word:Class) %>% mutate(Length/Frequency)Recall that there are two possible values in the
Classvariable in theratingsdataset: “animal” or “plant”. How many rows would be in the data frame returned by the following code block?ratings %>% group_by(Class) %>% summarise(n = n())Given the code block in the previous question, what will
n()do?True or false, the following code blocks will return the same dataframe
# code block 1 ratings %>% select(complexity = Complex) # code block 2 ratings %>% rename(complexity = Complex)Which of the following code blocks will return a dataframe including only the rows in
ratingsfor which the Class value is “animal”?# code block a ratings %>% filter(Class = "animal") # code block b ratings %>% filter(Class == "animal")By default the
arrange()function arranges the rows in ascending order. Which of the following code blocks would arrange the Frequency variable in descending order?# code block a ratings %>% arrange(Frequency, order = "descending") # code block b ratings %>% arrange(Frequency, order = "reverse") # code block c ratings %>% arrange(desc(Frequency))Which of the following code blocks could be used to return the mean frequency by class?
# code block a
ratings %>% group_by(Class) %>% summarise( mean = mean(Frequency) )

# code block b
ratings %>% summarise(
    mean = mean(Frequency), .by = c(Class) )

# code block c
ratings %>% mean(Frequency) %>% group_by(Class)