Model Accuracy

Data Science for Studying Language and the Mind

Author

Katie Schuler

Published

October 29, 2024

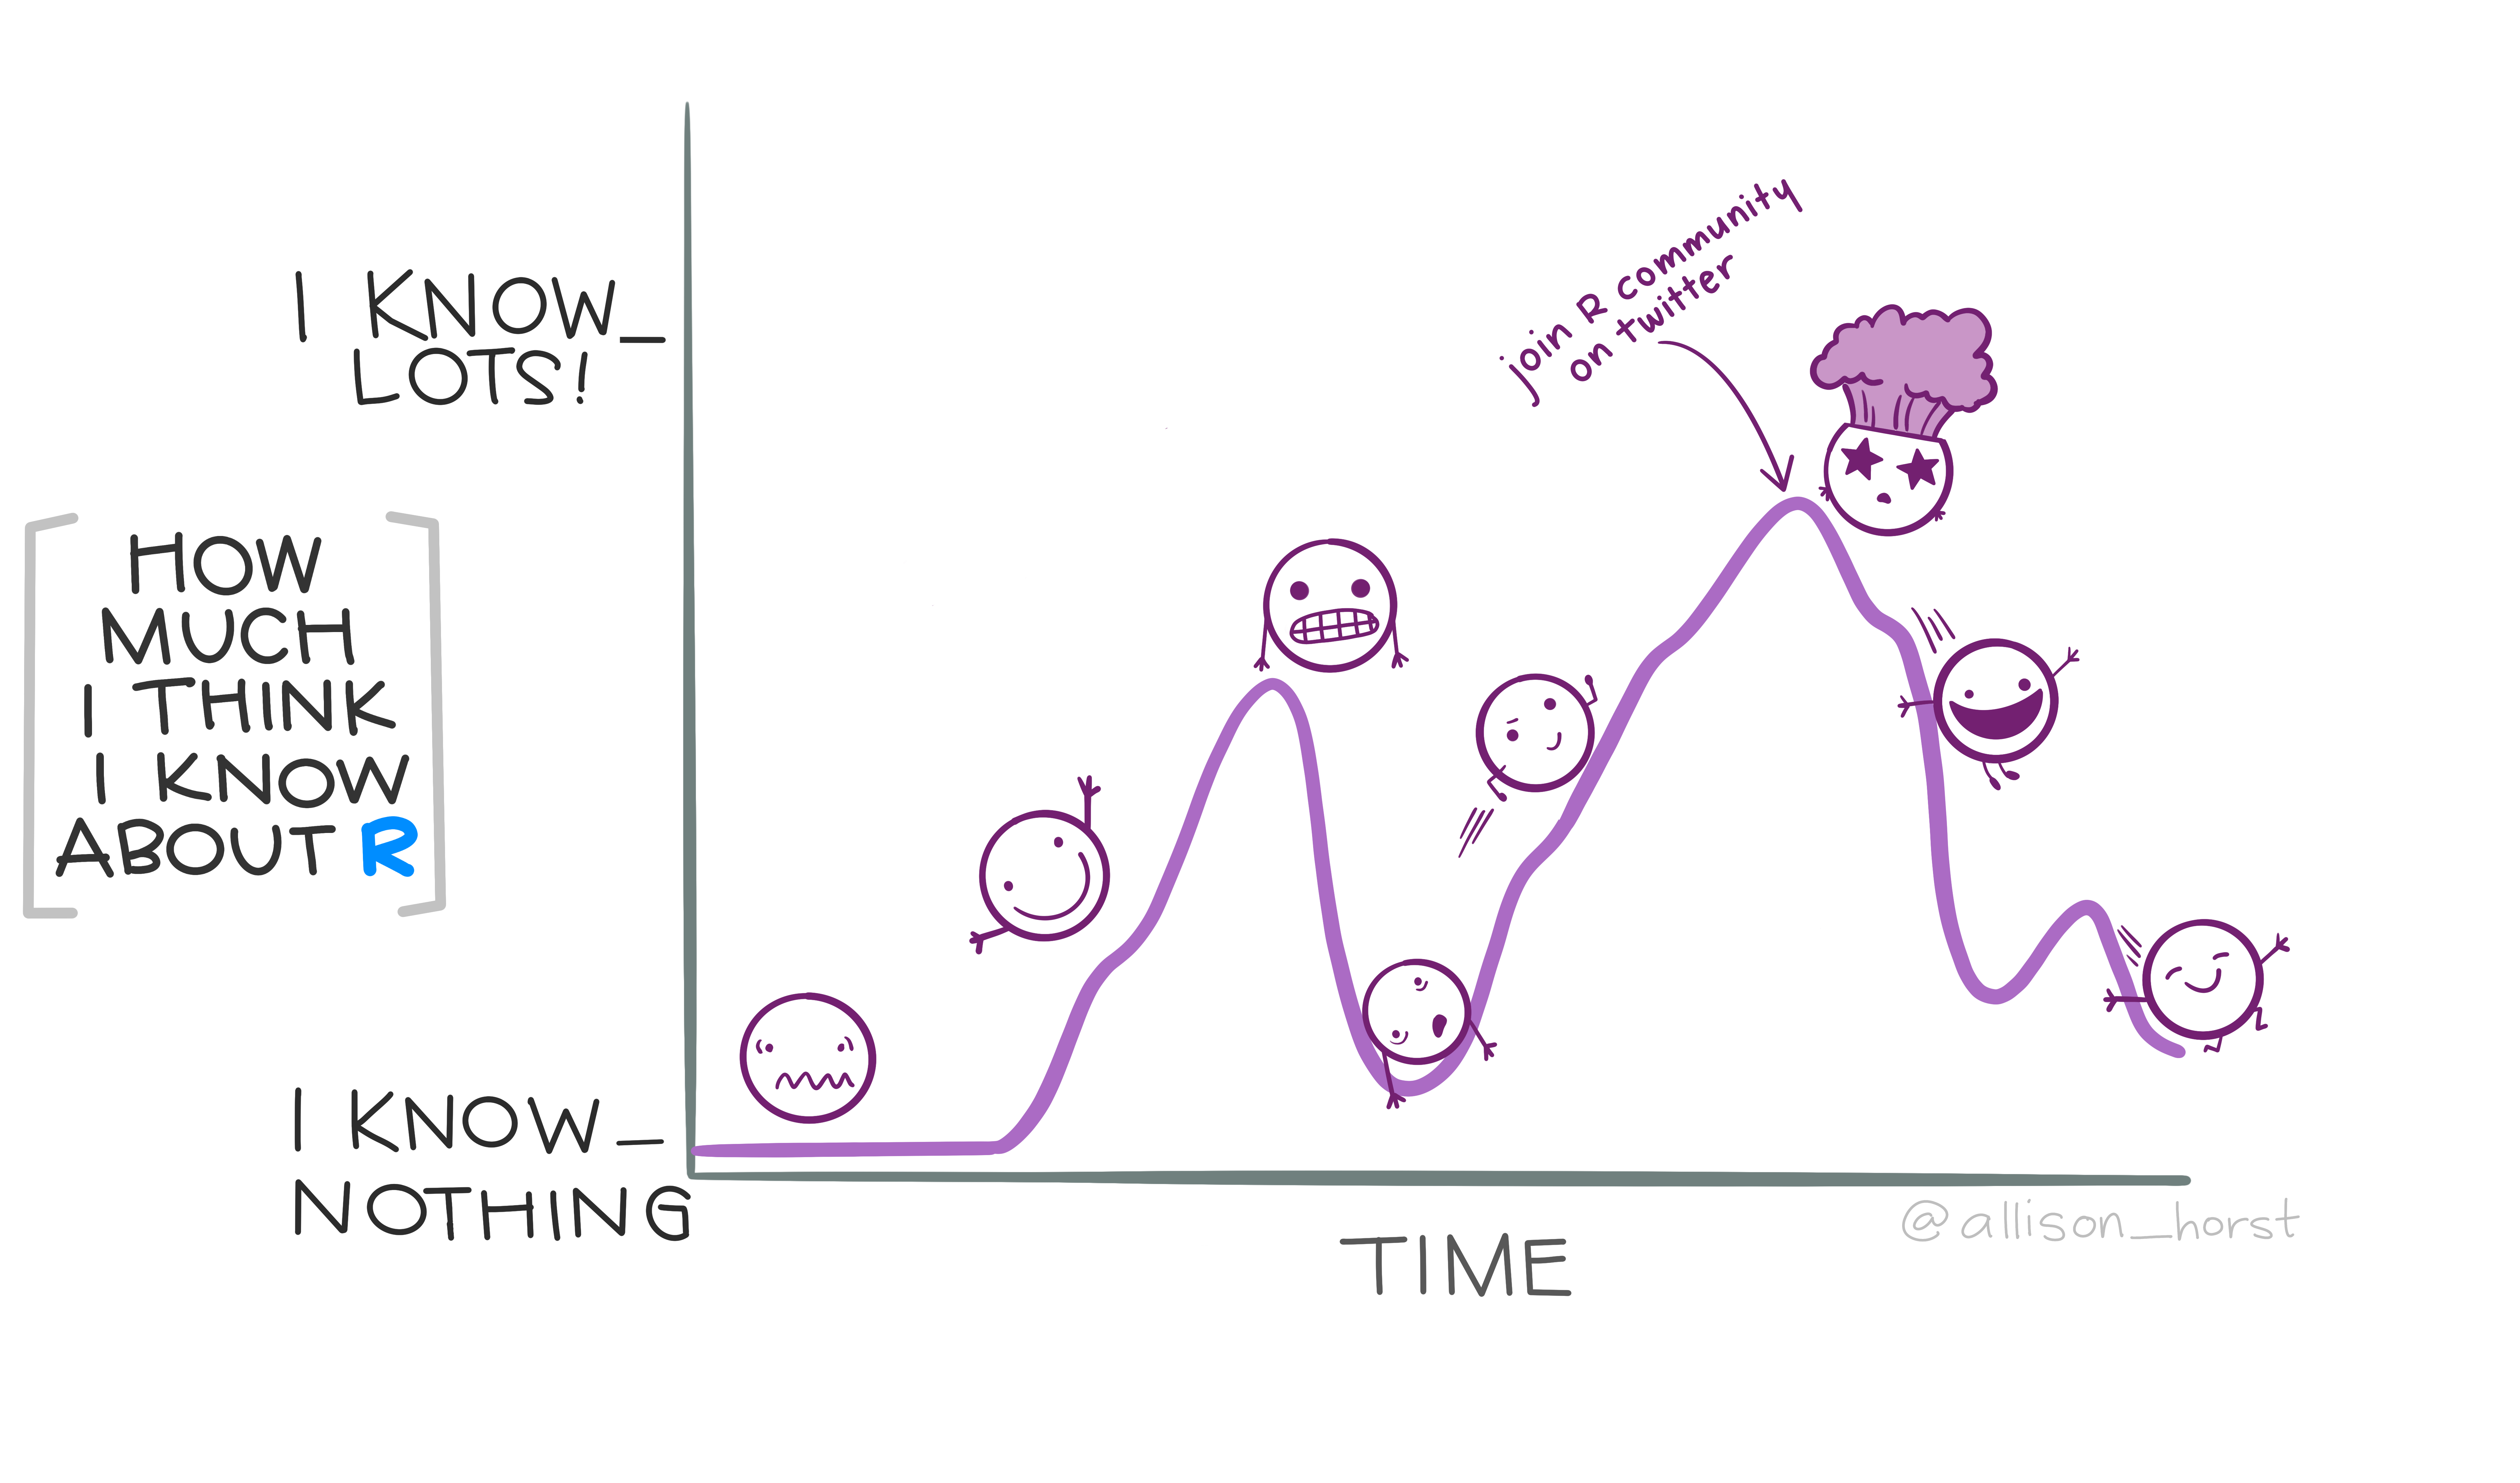
0.1 You are not alone

by Allison Horst

0.2 You are here

0.2.0.0.1 Data science with R
  • Hello, world!
  • R basics
  • Data visualization
  • Data wrangling
0.2.0.0.2 Stats & Model buidling
  • Sampling distribution
  • Hypothesis testing
  • Model specification
  • Model fitting
  • Model accuracy
  • Model reliability
0.2.0.0.3 More advanced
  • Classification
  • Inference for regression
  • Mixed-effect models

0.3 Model building overview

  • Model specification: what is the form?
  • Model fitting: you have the form, how do you guess the free parameters?
  • Model accuracy: you’ve estimated the parameters, how well does that model describe your data?
  • Model reliability: when you estimate the parameters, there is some uncertainty on them

0.4 Dataset

library(languageR)
glimpse(english)
Rows: 4,568
Columns: 36
$ RTlexdec                        <dbl> 6.543754, 6.397596, 6.304942, 6.424221…
$ RTnaming                        <dbl> 6.145044, 6.246882, 6.143756, 6.131878…
$ Familiarity                     <dbl> 2.37, 4.43, 5.60, 3.87, 3.93, 3.27, 3.…
$ Word                            <fct> doe, whore, stress, pork, plug, prop, …
$ AgeSubject                      <fct> young, young, young, young, young, you…
$ WordCategory                    <fct> N, N, N, N, N, N, N, N, N, N, N, N, N,…
$ WrittenFrequency                <dbl> 3.9120230, 4.5217886, 6.5057841, 5.017…
$ WrittenSpokenFrequencyRatio     <dbl> 1.02165125, 0.35048297, 2.08935600, -0…
$ FamilySize                      <dbl> 1.3862944, 1.3862944, 1.6094379, 1.945…
$ DerivationalEntropy             <dbl> 0.14144, 0.42706, 0.06197, 0.43035, 0.…
$ InflectionalEntropy             <dbl> 0.02114, 0.94198, 1.44339, 0.00000, 1.…
$ NumberSimplexSynsets            <dbl> 0.6931472, 1.0986123, 2.4849066, 1.098…
$ NumberComplexSynsets            <dbl> 0.000000, 0.000000, 1.945910, 2.639057…
$ LengthInLetters                 <int> 3, 5, 6, 4, 4, 4, 4, 3, 3, 5, 5, 3, 5,…
$ Ncount                          <int> 8, 5, 0, 8, 3, 9, 6, 13, 3, 3, 1, 9, 1…
$ MeanBigramFrequency             <dbl> 7.036333, 9.537878, 9.883931, 8.309180…
$ FrequencyInitialDiphone         <dbl> 12.02268, 12.59780, 13.30069, 12.07807…
$ ConspelV                        <int> 10, 20, 10, 5, 17, 19, 10, 13, 1, 7, 1…
$ ConspelN                        <dbl> 3.737670, 7.870930, 6.693324, 6.677083…
$ ConphonV                        <int> 41, 38, 13, 6, 17, 21, 13, 7, 11, 14, …
$ ConphonN                        <dbl> 8.837826, 9.775825, 7.040536, 3.828641…
$ ConfriendsV                     <int> 8, 20, 10, 4, 17, 19, 10, 6, 0, 7, 14,…
$ ConfriendsN                     <dbl> 3.295837, 7.870930, 6.693324, 3.526361…
$ ConffV                          <dbl> 0.6931472, 0.0000000, 0.0000000, 0.693…
$ ConffN                          <dbl> 2.7080502, 0.0000000, 0.0000000, 6.634…
$ ConfbV                          <dbl> 3.4965076, 2.9444390, 1.3862944, 1.098…
$ ConfbN                          <dbl> 8.833900, 9.614738, 5.817111, 2.564949…
$ NounFrequency                   <int> 49, 142, 565, 150, 170, 125, 582, 2061…
$ VerbFrequency                   <int> 0, 0, 473, 0, 120, 280, 110, 76, 4, 86…
$ CV                              <fct> C, C, C, C, C, C, C, C, V, C, C, V, C,…
$ Obstruent                       <fct> obst, obst, obst, obst, obst, obst, ob…
$ Frication                       <fct> burst, frication, frication, burst, bu…
$ Voice                           <fct> voiced, voiceless, voiceless, voiceles…
$ FrequencyInitialDiphoneWord     <dbl> 10.129308, 9.054388, 12.422026, 10.048…
$ FrequencyInitialDiphoneSyllable <dbl> 10.409763, 9.148252, 13.127395, 11.003…
$ CorrectLexdec                   <int> 27, 30, 30, 30, 26, 28, 30, 28, 25, 29…
0.5 Quantifying model accuracy

  • We can visualize to get a sense of accuracy
  • But want to quantify accuracy (determine whether model is useful or how it compares to other models)

0.6 Quantifying model accuracy

  • sum of squared error (depends on units, difficult to interpret)
  • \(R^2\) (independent of units, easy to interpret)
  • \(R^2\) quantifies the percentage of variance in the response variable that is explained by the model.

0.7 Coefficient of determination, \(R^2\)

  • How much error (variation) is left over in the simplest possible model, RTlexdec ~ 1? This is our reference model and represents the total variance.

0.8 Coefficient of determination, \(R^2\)

  • How much error (variation) is left over in our specified model, RTlexdec ~ 1 + WrittenFrequency?

0.9 Coefficient of determination, \(R^2\)

. . .

\(R^2=100\times(1-\frac{\sum_{i=1}^n (y_i - m_i)^2}{\sum_{i=1}^n (y_i - \overline{y})^2})\)

. . .

\(R^2=100\times(1-\frac{SSE_{model}}{SSE_{reference}})\)

. . .

\(R^2=100\times(1-\frac{unexplained \; variance}{total \; variance})\)

0.10 Coefficient of determination, \(R^2\)

. . .

$R^2=100(1-) = 100 = 0.4081037 $

0.11 Coefficient of determination, \(R^2\)

\(R^2=100\times(1-\frac{SSE_{model}}{SSE_{reference}})\)

. . .

# compute R2 from SSEs
1 - (sse_model/sse_ref)
[1] 0.4081037

. . .

# compute R2 from lm
summary(model)

Call:
lm(formula = RTlexdec ~ 1 + WrittenFrequency, data = young_nouns_sample)

Residuals:
     Min       1Q   Median       3Q      Max 
-0.10323 -0.04426 -0.02401  0.03499  0.18496 

Coefficients:
                  Estimate Std. Error t value Pr(>|t|)    
(Intercept)       6.590645   0.044550 147.940  < 2e-16 ***
WrittenFrequency -0.028736   0.008157  -3.523  0.00243 ** 
---
Signif. codes:  0 '***' 0.001 '**' 0.01 '*' 0.05 '.' 0.1 ' ' 1

Residual standard error: 0.07984 on 18 degrees of freedom
Multiple R-squared:  0.4081,    Adjusted R-squared:  0.3752 
F-statistic: 12.41 on 1 and 18 DF,  p-value: 0.00243

1 What is adjusted \(R^2\)?

1.1 \(R^2\) overestimates model accuracy

One thing we can ask is how well the model describes our specific sample of data. But the question we actually want to answer is how well does the model we fit describe the population we are interested in.

  • The problem is that we usually only have access to the sample we’ve collected and \(R^2\) tends to overestimate the accuracy of the model on the population. In other words, the \(R^2\) of the model we fit on our sample will be larger than the \(R^2\) of the model fit to the population.
  • Further, the population is (usually) unknown to us. To quantify the true accuracy of a fitted model – that is, how well the model describes the population, not the sample we collected – we can use a technique called cross-validation.

1.2 \(R^2\) overestimates model accuracy

Population Sample
True high
Fitted

1.3 \(R^2\) overestimates model accuracy

Population Sample
True high high
Fitted

1.4 \(R^2\) overestimates model accuracy

Population Sample
True high high
Fitted low

1.5 \(R^2\) overestimates model accuracy

Population Sample
True high high
Fitted low very high
  • Accuracy of the fitted model on the sample overestimates true accuracy of fitted model.

1.6 Overfitting

You have the freedom to fit your sample data better and better (you can add more and more terms, increasing the \(R^2\) value). But be careful not to fit the sample data too well.

  • any given set of data contains not only the true model (signal), but also random variation (noise).
  • Fitting the sample data too well means we fit not only the signal but also the noise in the data.
  • An overfit model will perform really well on the data it has been trained on (the sample), but would predict new, unseen values poorly.
  • Our goal is to find the optimal fitted model – the one that gets as close to the true model as possible without overfitting.

1.7 Overfitting exercise

  • Let’s use the swim records data to demonstrate that \(R^2\) increases as we add more parameters.

1.8 Cross-validation justificaiton

  • We want to know: how well does the model we fit describe the population we are interested in.
  • But we only have the sample, and \(R^2\) on the sample will tend to overestimate the model’s accuracy on the population.
  • To estimate the accuracy of the model on the population, we can use cross-validation

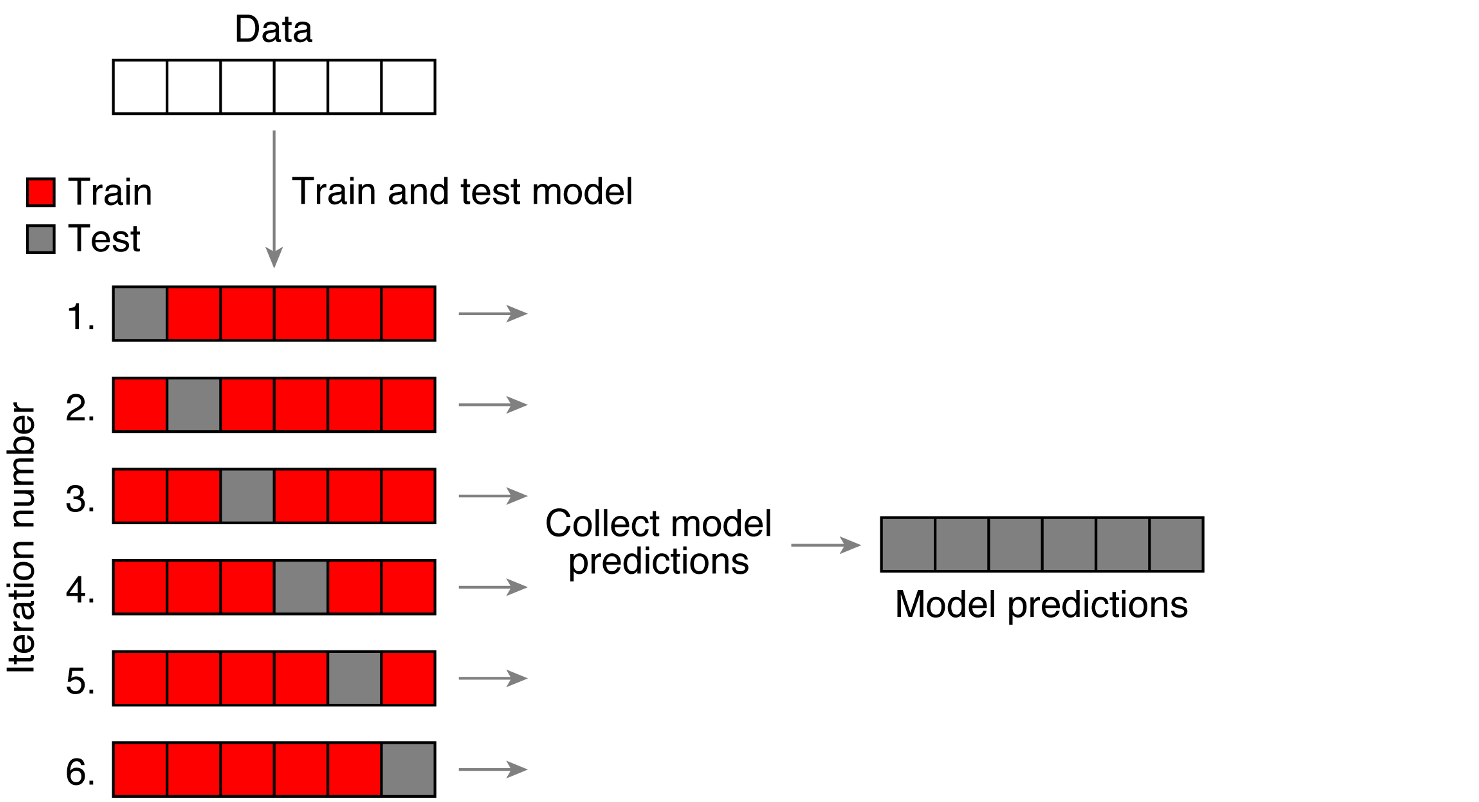
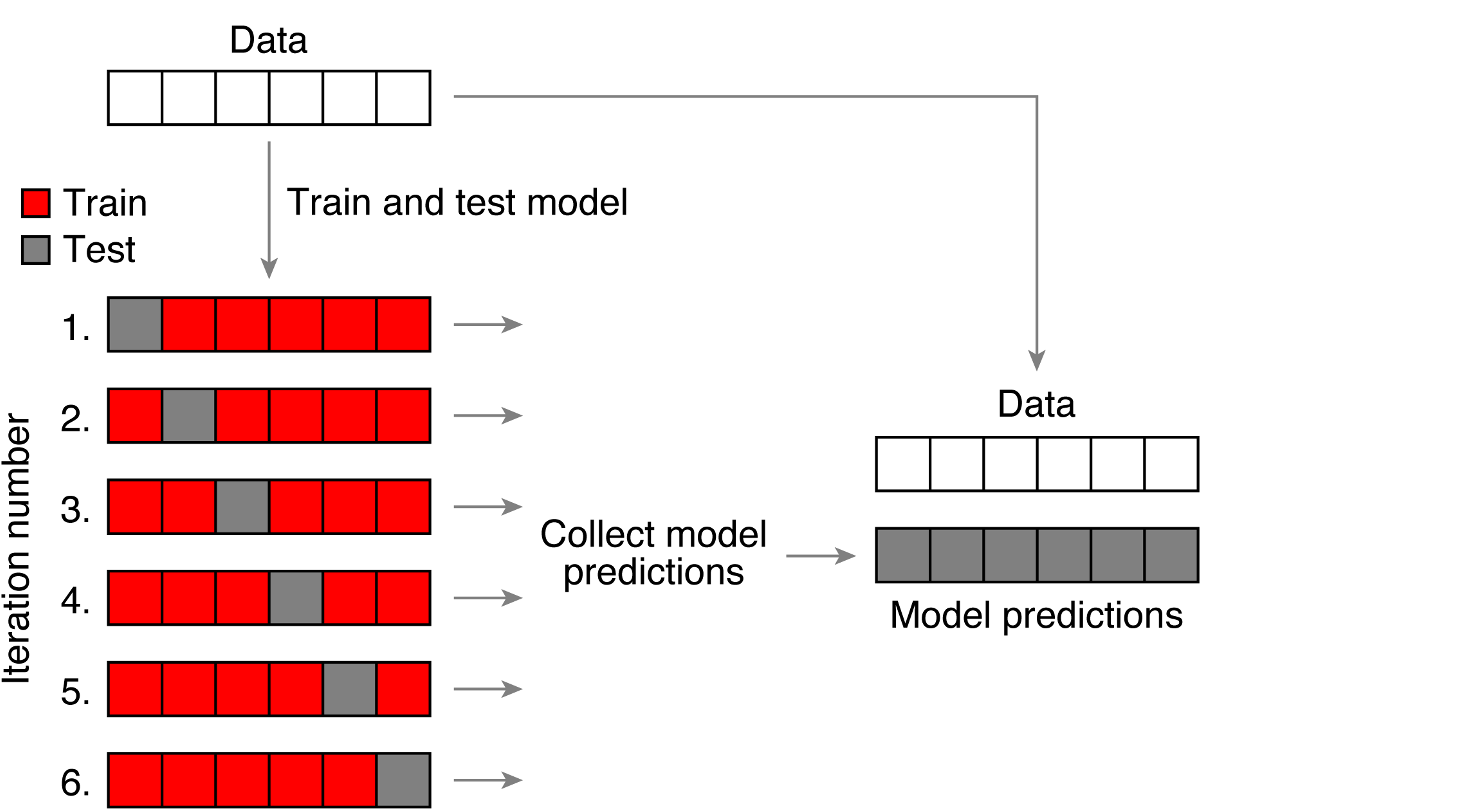
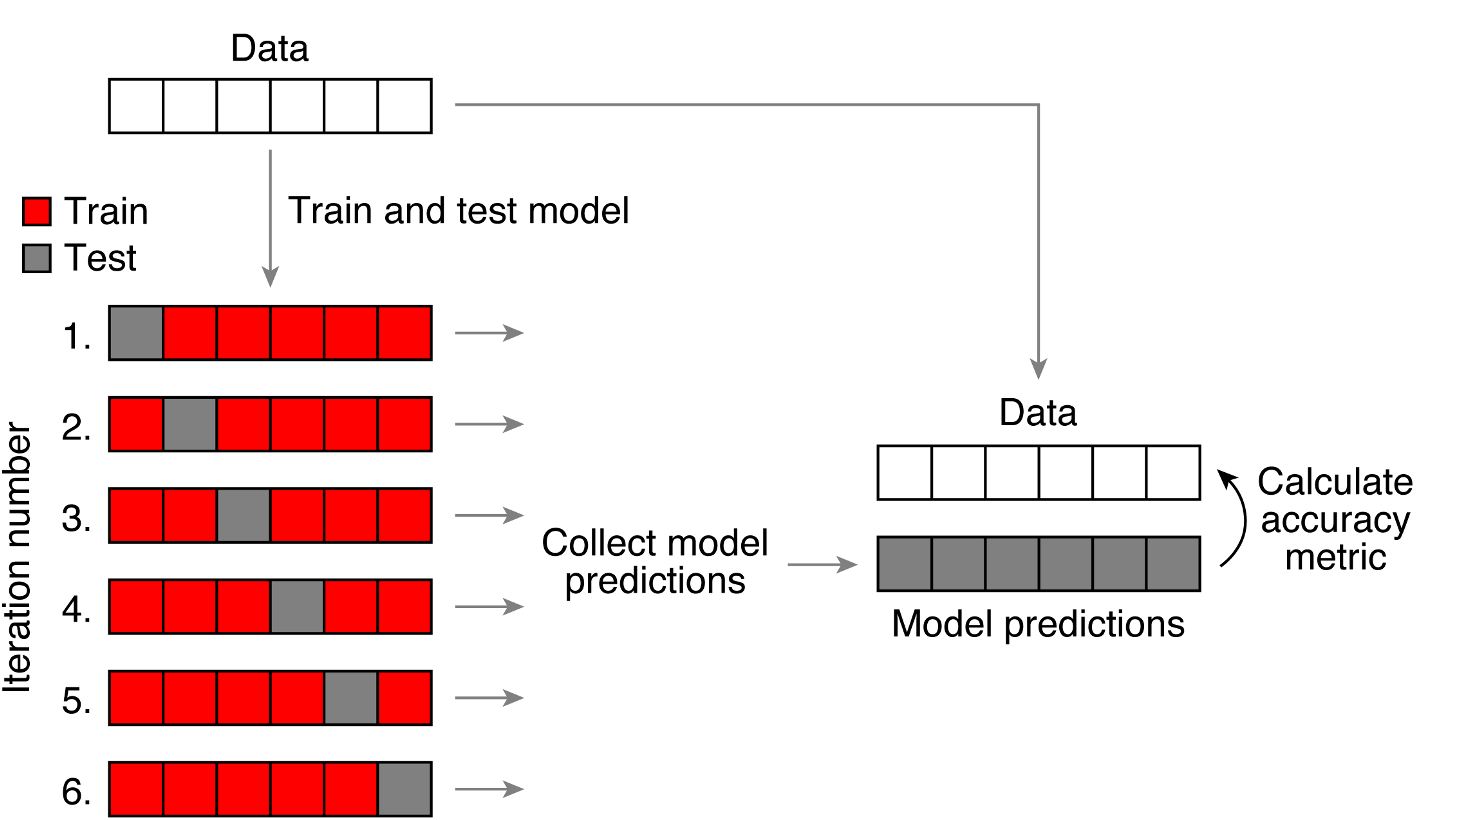
1.9 Cross-validation steps

Given a sample of data, there are 3 simple steps to any cross-validation technique:

  1. Leave some data out
  2. Fit a model (to the data kept in)
  3. Evaluate the model on the left out data (e.g. \(R^2\))

. . .

There are many ways to do cross-validation — reflecting that there are many ways we can leave some data out — but they all follow this general 3-step process.

1.10 Two common cross-validation approaches

  • In leave-one-out cross-validation, we leave out a single data point and use the fitted model to predict that single point. We repeat this process for every data point, then evaluate each model’s prediction on the left out points (we can use \(R^2\)!).
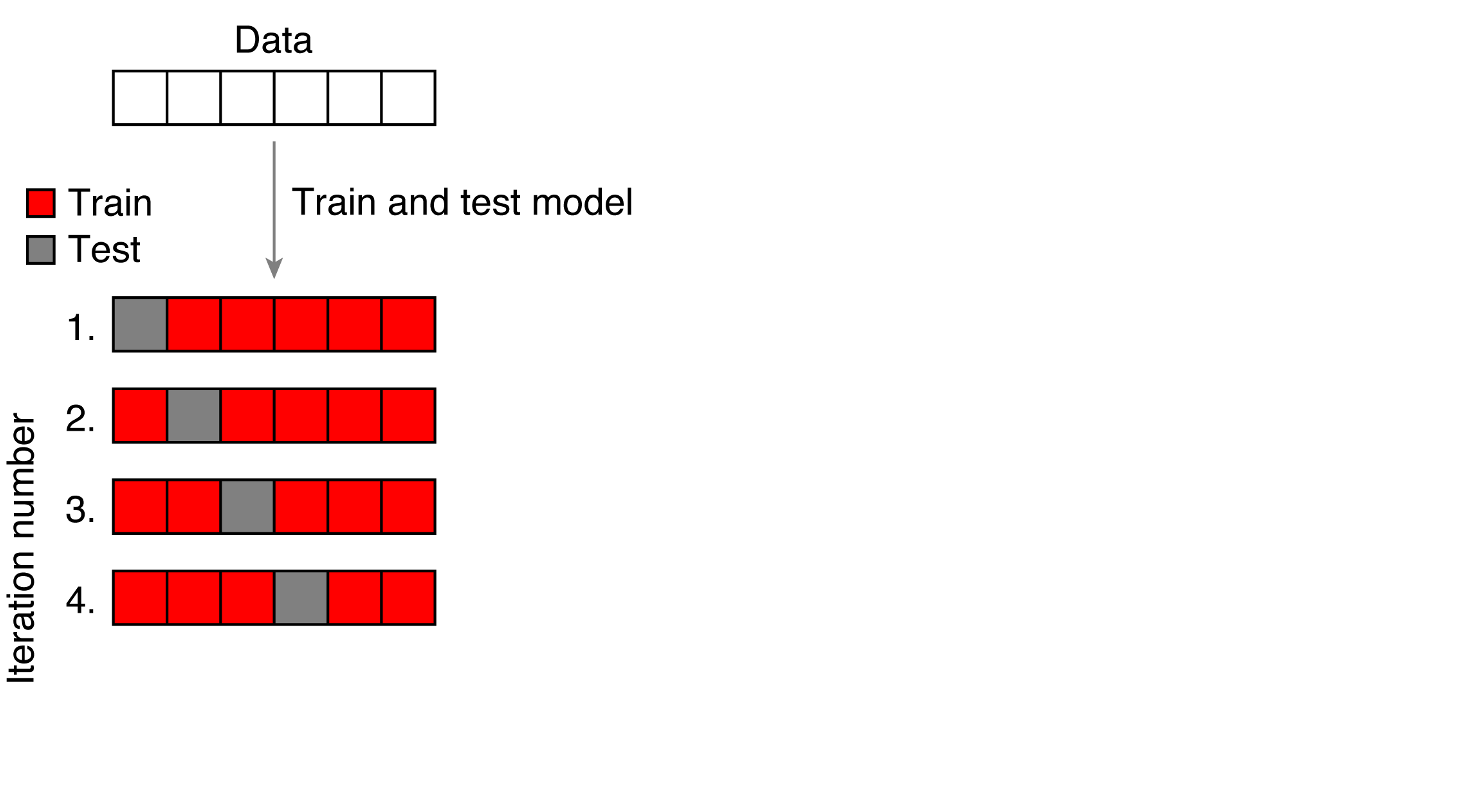
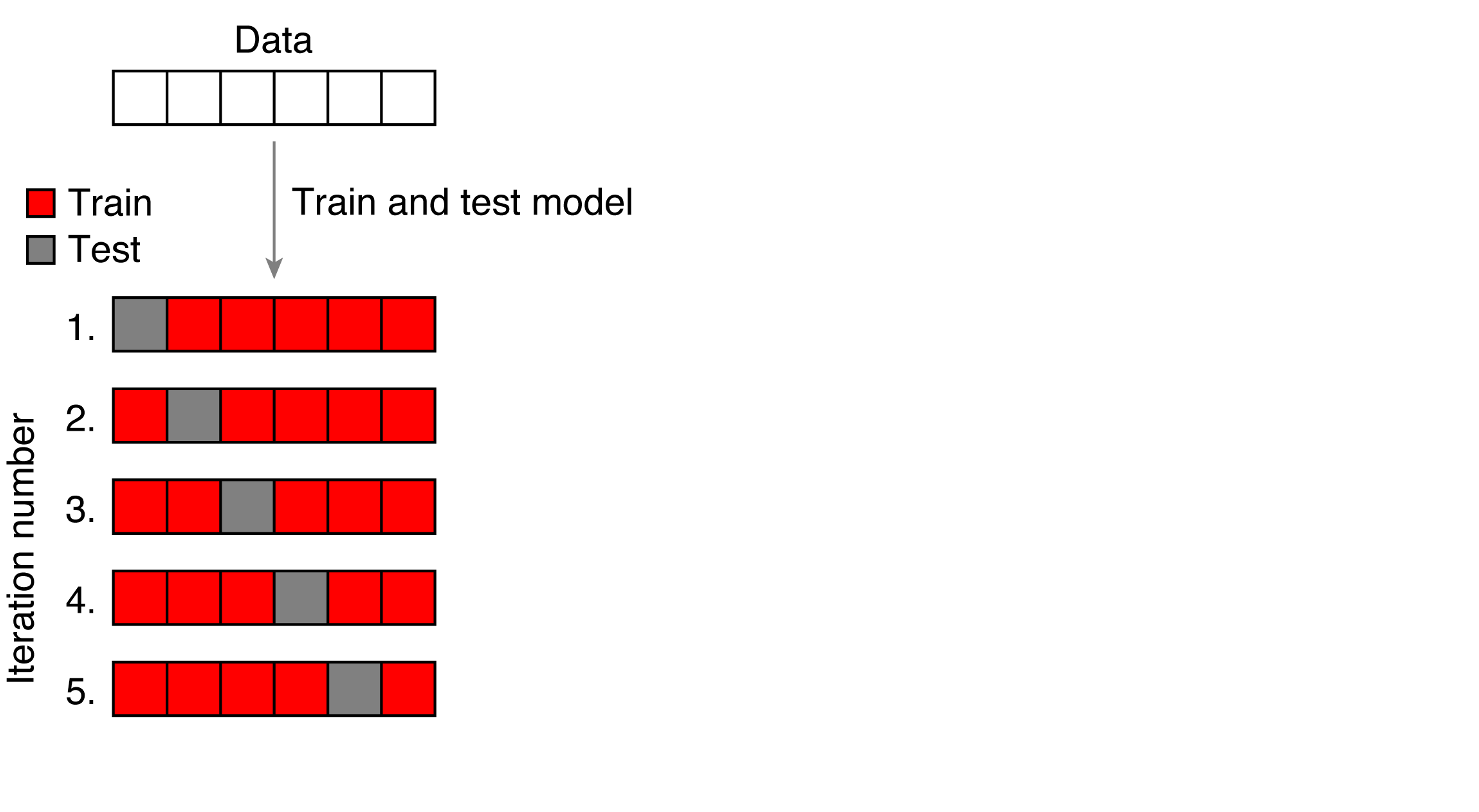
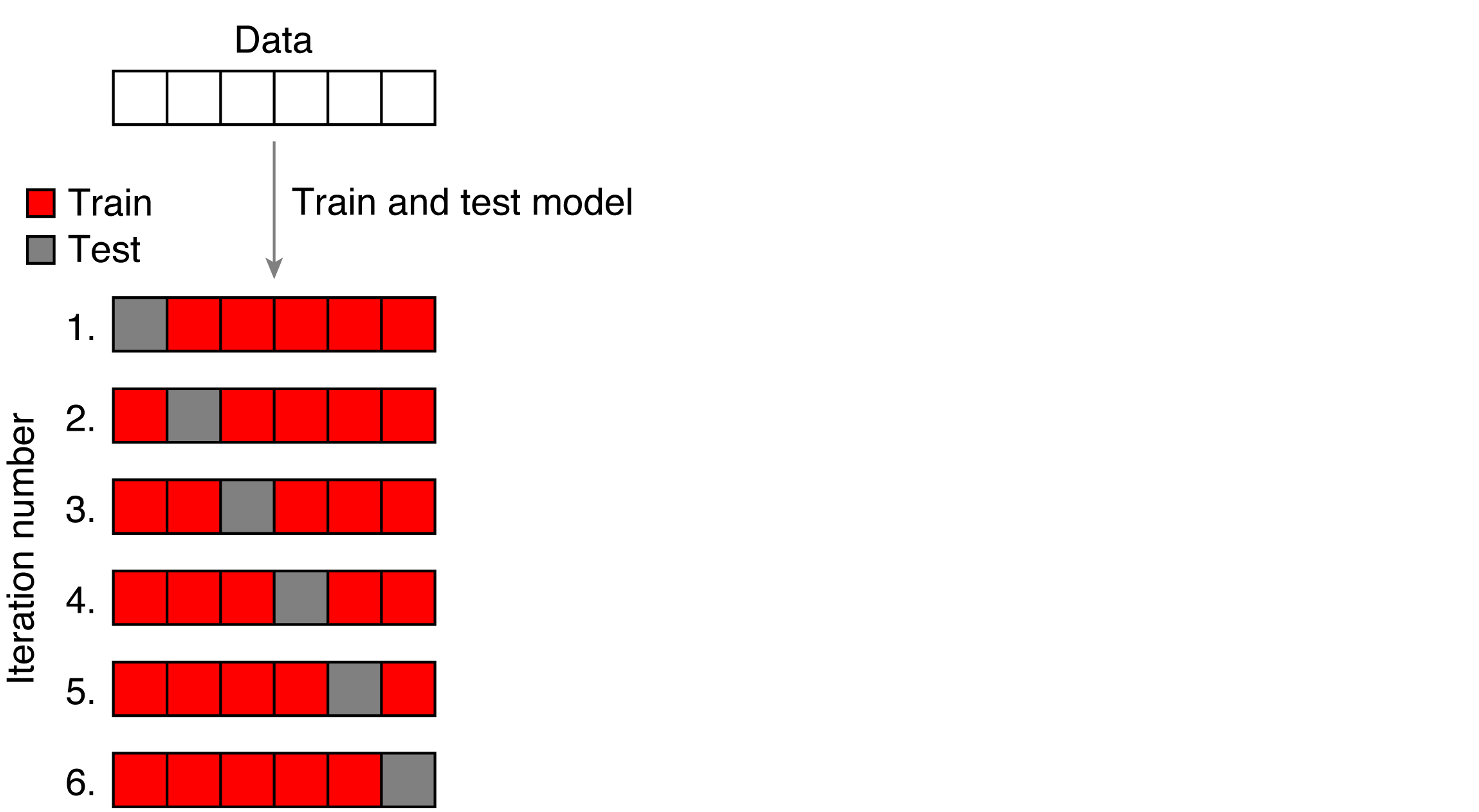
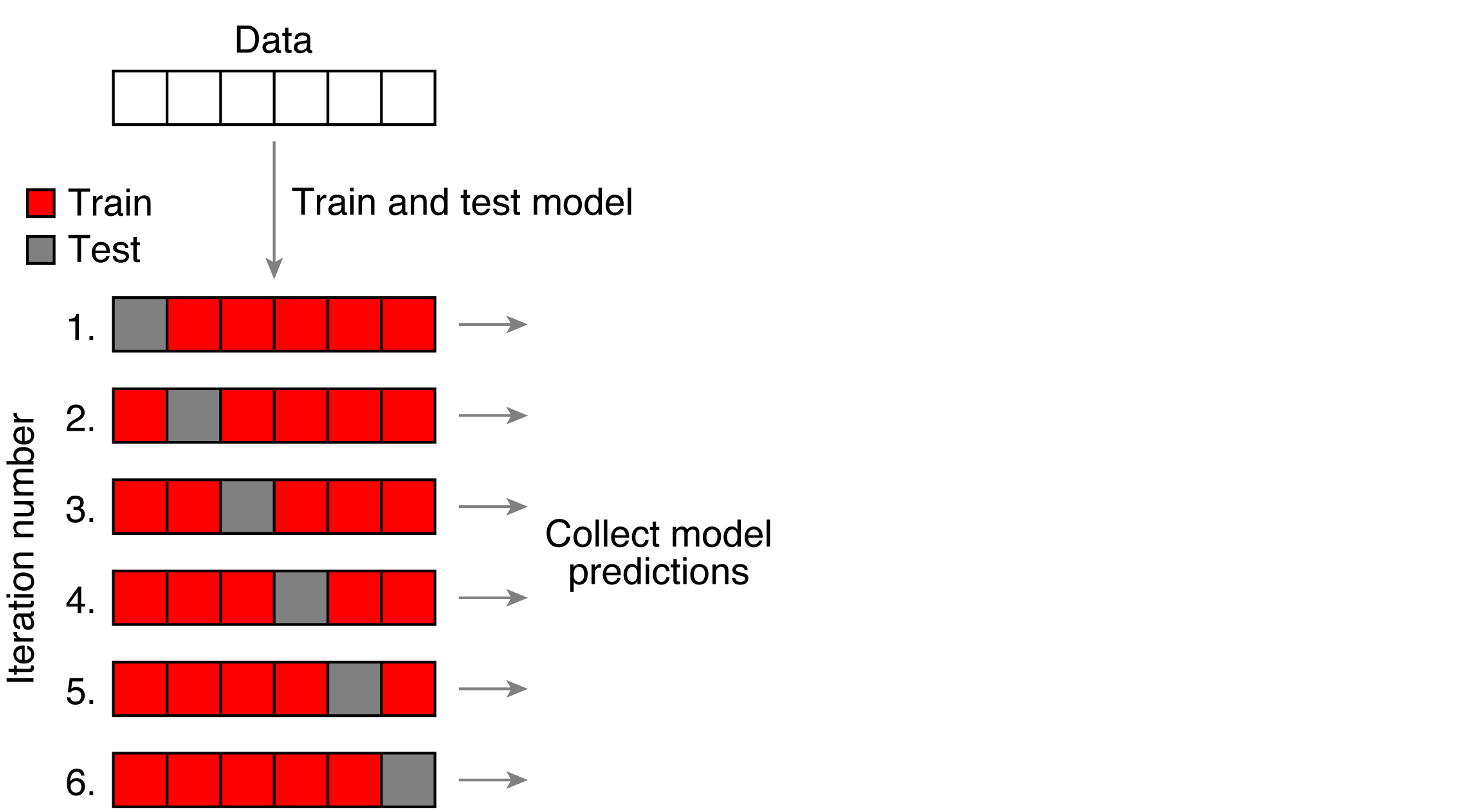
  • In k-fold cross-validation, instead of leaving out a single data point, we randomly divide the dataset into \(k\) parts and use the fitted model to predict that part. We repeat this process for every part, then evaluate each model’s prediction on the left out parts (again, we can use \(R^2\)!).

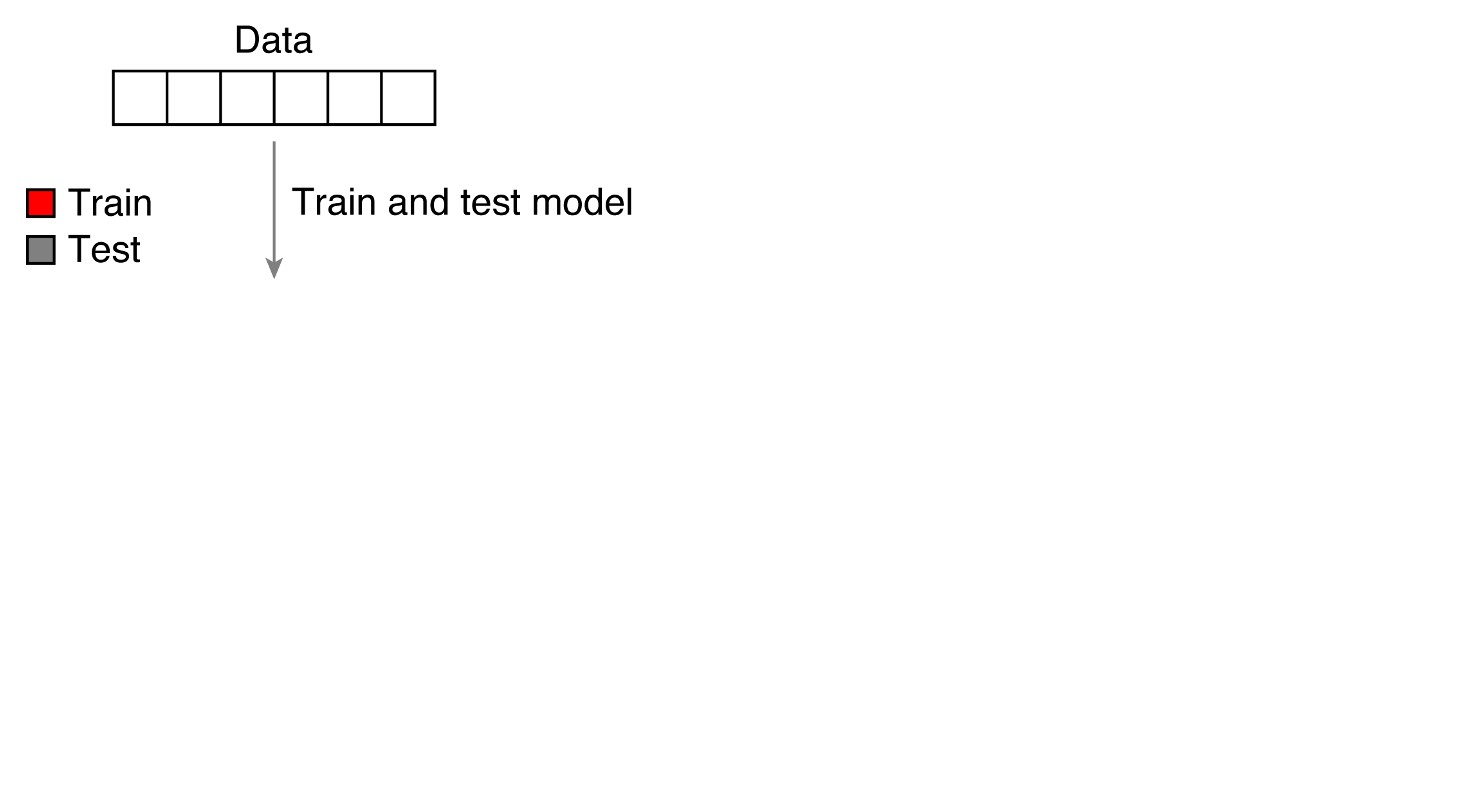
1.11 Leave-one-out cross-validation

Figure borrowed from Kendrick Kay

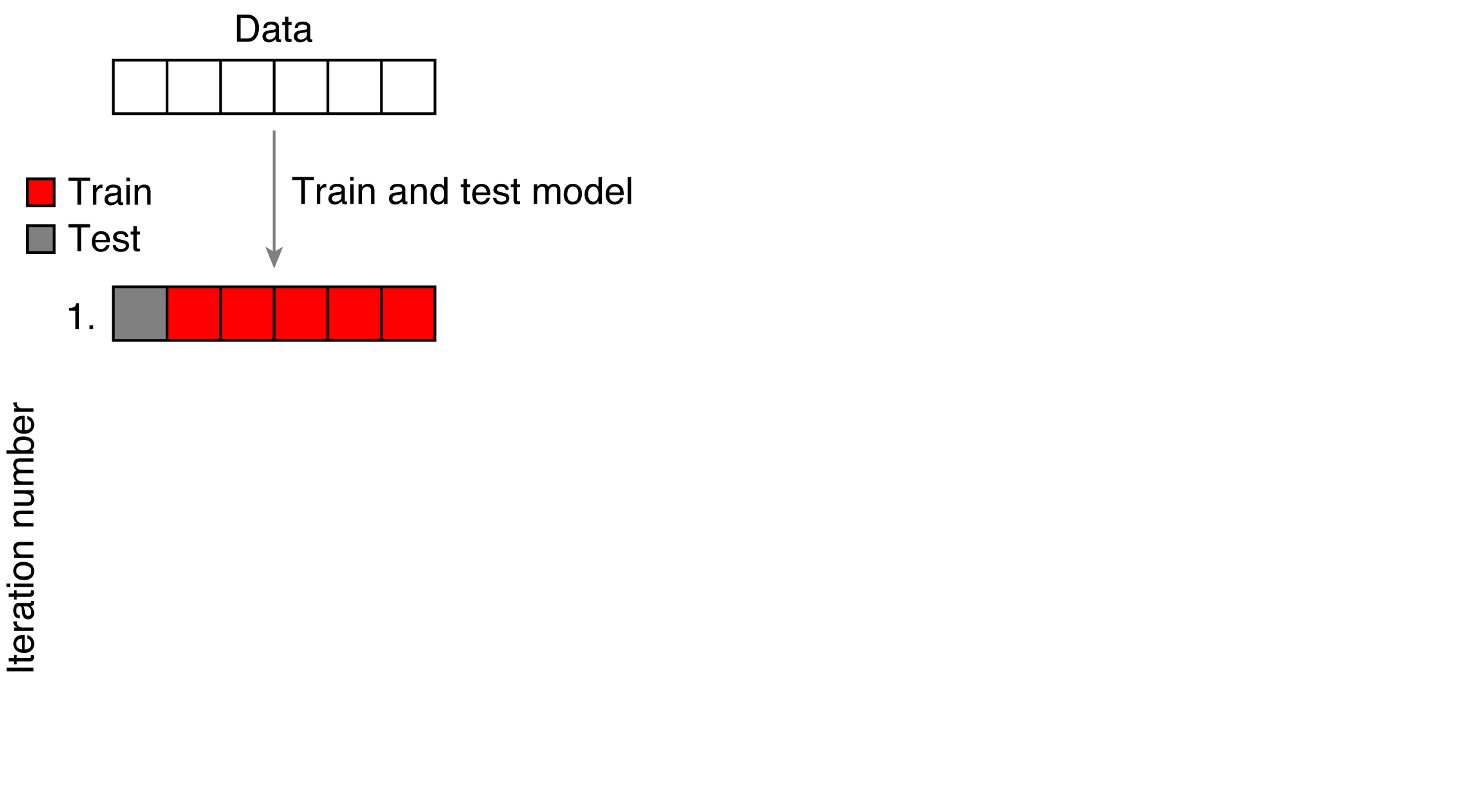
1.12 Leave-one-out cross-validation

Figure borrowed from Kendrick Kay

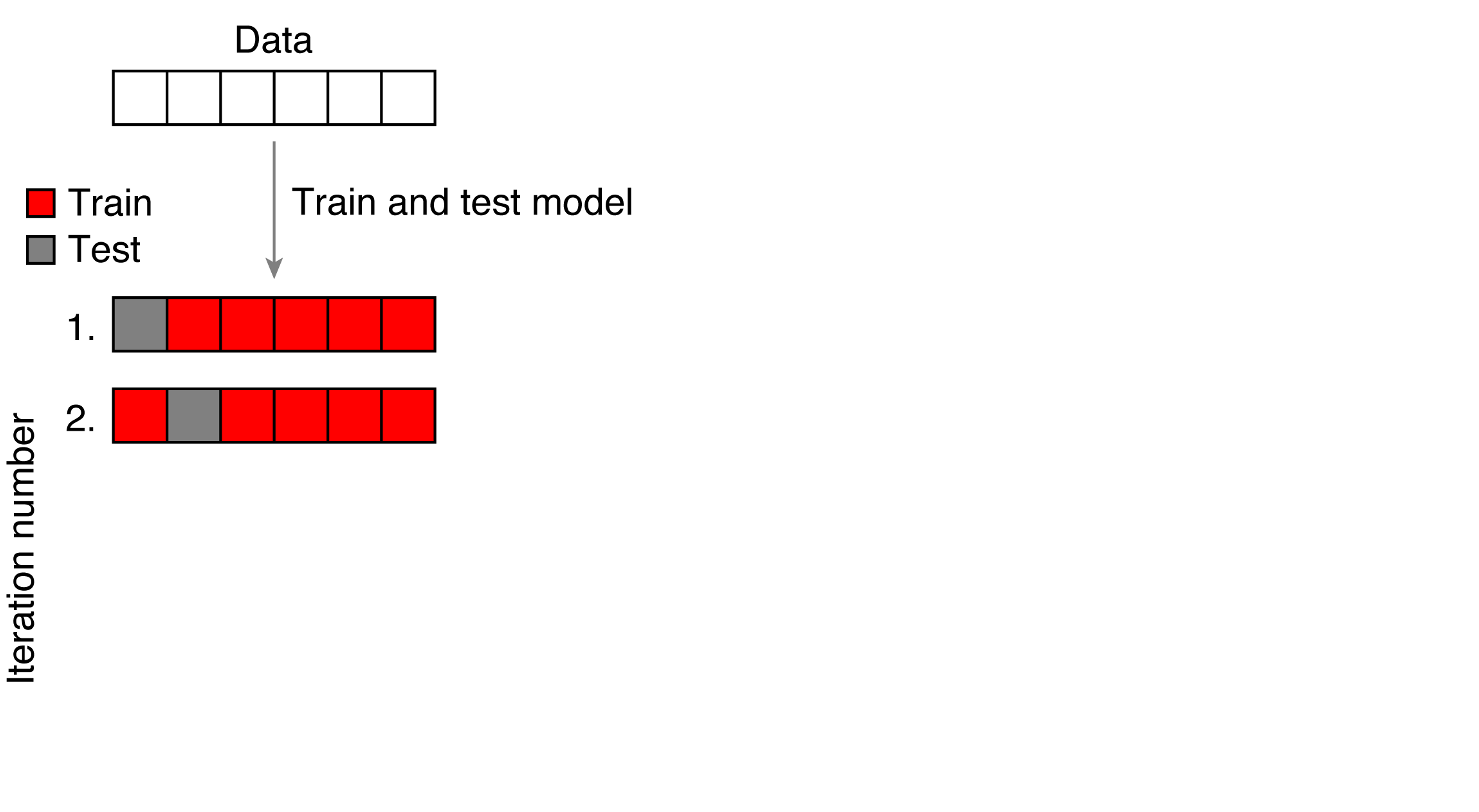
1.13 Leave-one-out cross-validation

Figure borrowed from Kendrick Kay

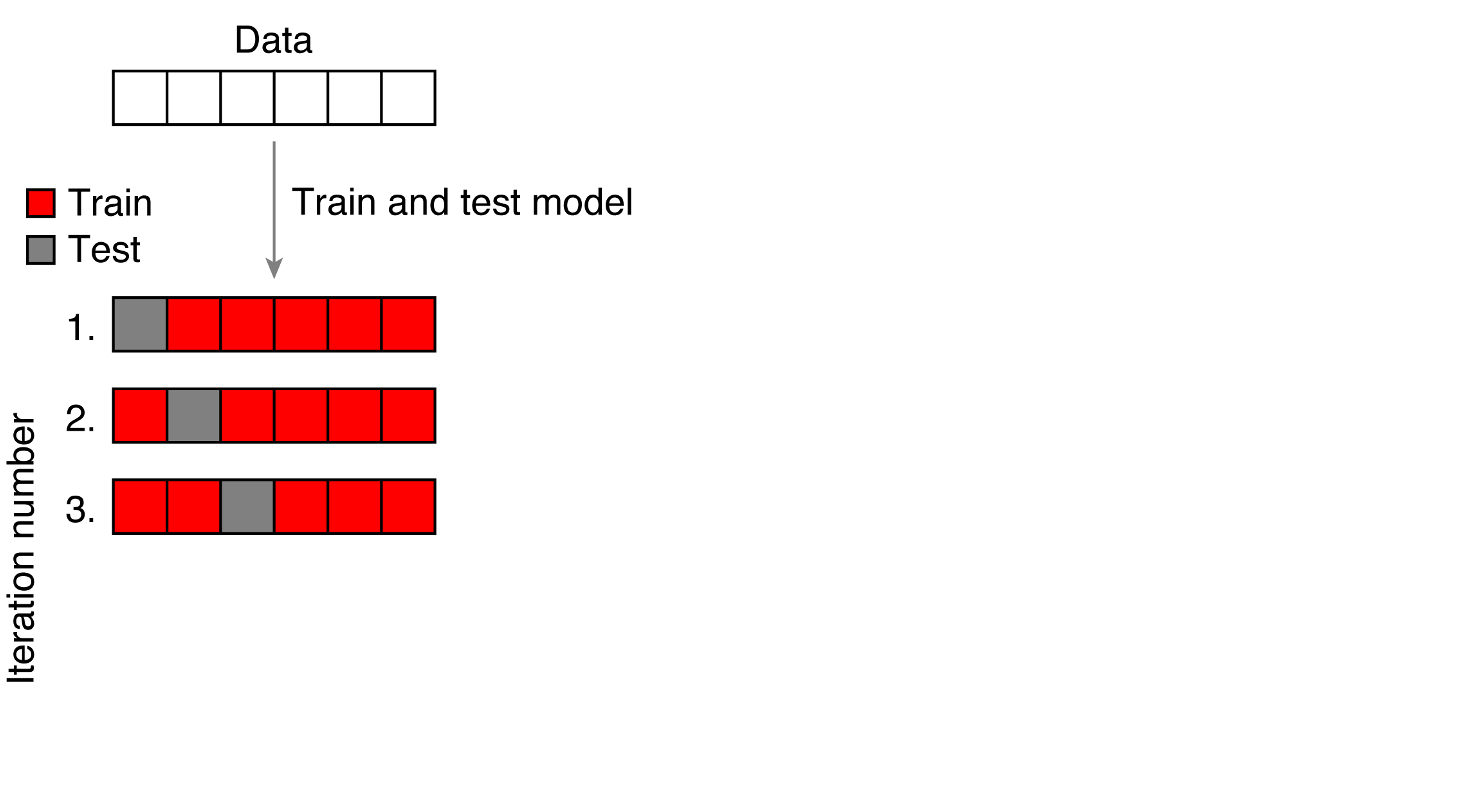
1.14 Leave-one-out cross-validation

Figure borrowed from Kendrick Kay

1.15 Leave-one-out cross-validation

Figure borrowed from Kendrick Kay

1.16 Leave-one-out cross-validation

Figure borrowed from Kendrick Kay

1.17 Leave-one-out cross-validation

Figure borrowed from Kendrick Kay

1.18 Leave-one-out cross-validation

Figure borrowed from Kendrick Kay

1.19 Leave-one-out cross-validation

Figure borrowed from Kendrick Kay

1.20 Leave-one-out cross-validation

Figure borrowed from Kendrick Kay

1.21 Leave-one-out cross-validation

Figure borrowed from Kendrick Kay

1.22 Leave-one-out cross-validation

Figure borrowed from Kendrick Kay

2 Thursday

2.1 Other methods

There are other ways to evaluate models beyond cross-validaiton. We’ll mention a few more:

  1. F-test
  2. AIC (Akaike Information Criterion)
  3. BIC (Bayesian Information Criterion)

2.2 F-test

  • One common way is using an F-test to determine whether a more complex model produces a significantly better fit than a simpler one.
  • This approach only applies for nested models, which just means that one model is a simpler version of another more complex one.
  • We will return to this in the demo.

2.3 AIC and BIC

  • You may also encounter AIC (Akaike Information Criterion) and BIC (Bayesian Information Criterion).
  • These are parametric approaches that attempt to compare different models and find the optimal fit (helping you avoid overfitting and excessively complex models).

2.4 AIC and BIC, what’s the difference?

  • In general AIC considers how well the model fits the data, the number of parameters, and the sample size (there is a penalty for more complex models); BIC is similar but has a stronger penalty for complex models (so will inherently favor simpler models).

2.5 What we’ll demo:

  • We’ll focus on cross-validation in this class, because it makes fewer assumptions than metrics like AIC/BIC and is simpler to understand conceptually. But we’ll also show you the F-test approach, since it’s widely used in the sciences.

2.6 F-test (via anova())

The F-test is closely related to \(R^2\). When comparing a simpler model to a more complex one, the change in \(R^2\) (often expressed as \(\Delta R^2\)) can be evalutated using an F-test to see if adding predictors significantly improves model fit.

2.7 F-test and R^2

  • For \(R^2\), when we compared \(SSE_{model}\) (the sum of squared error of our model) to \(SSE_{reference}\) (the sum of squared error of the intercept-only model), we noted that \(SSE_{reference}\) is always going to be greater than \(SSE_{model}\).
  • But what we actually want to know is whether it is significantly greater.

2.8 Equation for F (in terms of \(R^2\))

Let \(R^2_{simple}\) be the \(R^2\) of the simpler model and \(R^2_{complex}\) be the \(R^2\) of the more complex model. The change in \(R^2\) (also called \(\Delta R^2\)) is:

  • \(\Delta R^2 = R^2_{complex} - R^2_{simple}\)

We can then compute the F-statistic to determine if \(\Delta R^2\) is significant.

  • \(F = \frac{\Delta R^2 / p }{(1-R^2_{complex}/(n-k-1))}\)

Where:

  • \(p\) is the number of additional predictors in the complex model
  • \(n\) is the total sample size
  • \(k\) is the number of predictors in the complex model

2.9 Understanding the F equation

\(F = \frac{\Delta R^2 / p }{(1-R^2_{complex}/(n-k-1))}\)

We can understand the numerator and denominator of this equation in the following way:

  • The numerator represents the increase in explained variance per additional predictor.
  • The denominator represents the remaining unexplained variance, adjusted for sample size and the complexity of the model.

2.10 F-test demo

In R, we can perform this model comparison via and F-test via a call to anova():

model_int <- lm(RTlexdec ~ 1, english)
model_freq <- lm(RTlexdec ~ WrittenFrequency, english)
model_freqage <- lm(RTlexdec ~ WrittenFrequency + AgeSubject, english)
model_freqagelength <- lm(RTlexdec ~ WrittenFrequency + AgeSubject + LengthInLetters, english)

anova(model_int, model_freq, model_freqage, model_freqagelength)
Analysis of Variance Table

Model 1: RTlexdec ~ 1
Model 2: RTlexdec ~ WrittenFrequency
Model 3: RTlexdec ~ WrittenFrequency + AgeSubject
Model 4: RTlexdec ~ WrittenFrequency + AgeSubject + LengthInLetters
  Res.Df     RSS Df Sum of Sq         F  Pr(>F)    
1   4567 112.456                                   
2   4566  91.194  1    21.261 2772.1326 < 2e-16 ***
3   4565  35.053  1    56.141 7319.9087 < 2e-16 ***
4   4564  35.004  1     0.049    6.3563 0.01173 *  
---
Signif. codes:  0 '***' 0.001 '**' 0.01 '*' 0.05 '.' 0.1 ' ' 1

2.11 F-test interpretation

If the F-statistic is large, it suggests that the additional predictors in the complex model significantly improve model fit.

To help you decide, anova() returns a p-value. You can understand this p-value as asking: how likely it is to observe this value of F if we randomly added this many predictors to our model?

2.12 Back to model selection

  • Building models is itself an iterative process: we can use model accuracy obtained via cross-validation to determine which model to select (as a way to find the elusive optimal model fit).

  • Beyond model accuracy, there are other practical things one might want to consider when selecting a model, such as ease of interpretation and availability of resources (the data you can collect, the computing power you have, etc.)