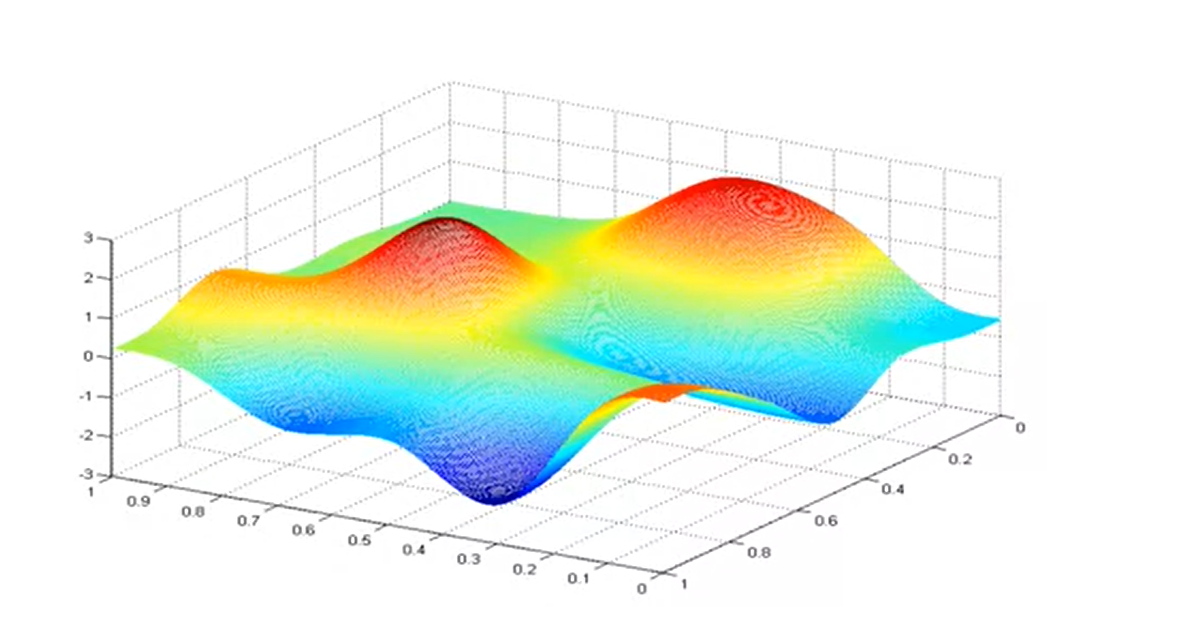
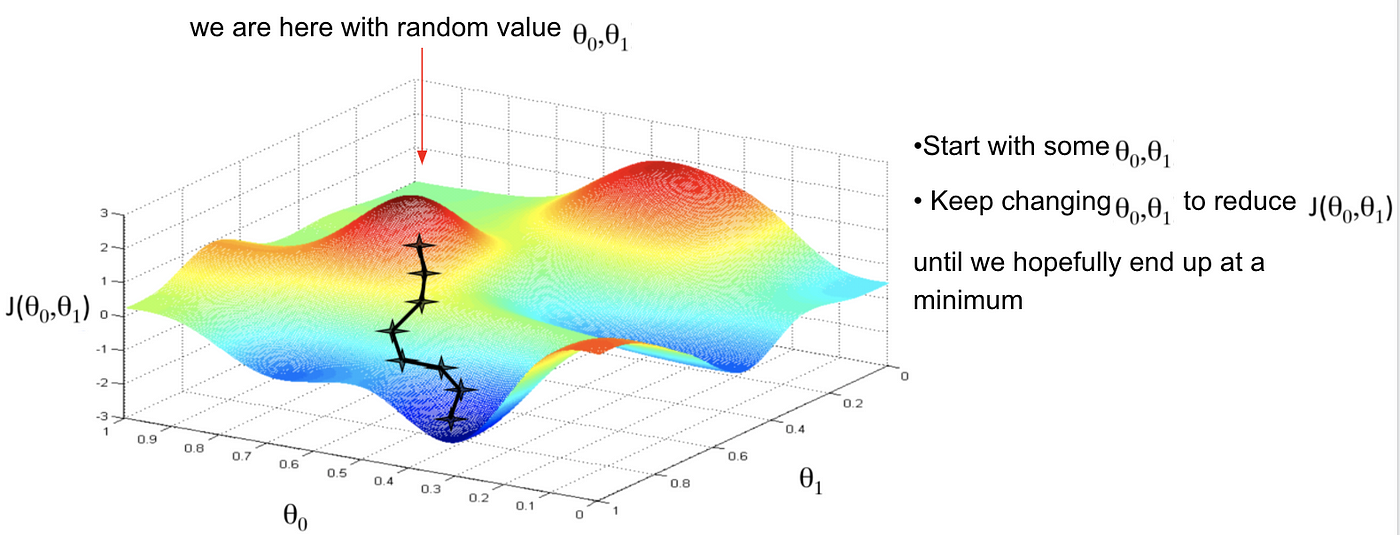
A potential problem with iterative optimization algorithms is the risk of finding a local minimum.
Local minimum is only relevant for nonlinear models
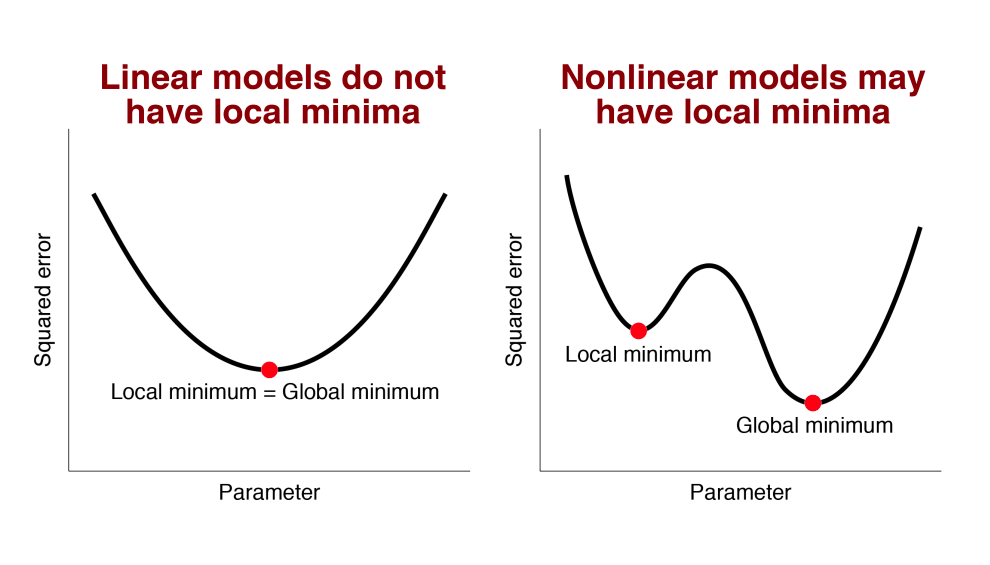
Only nonlinear models have this potential problem. Even it higher dimensions.
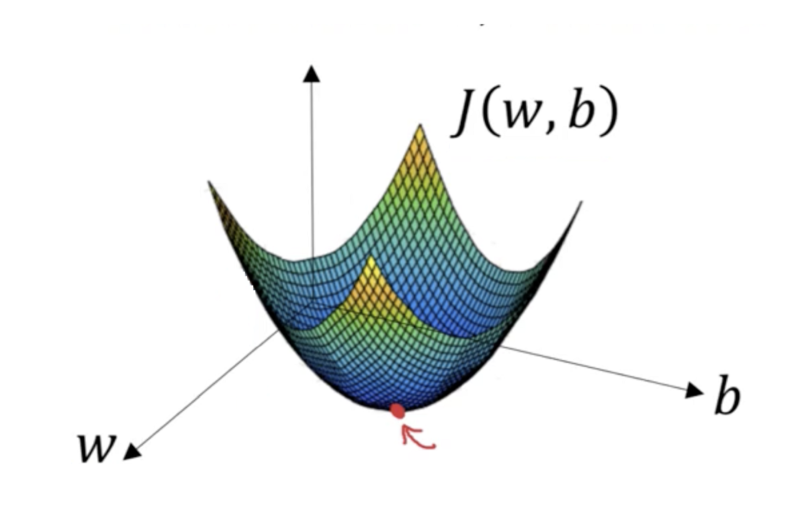
Linear models do not have this problem
For all linear models, we can think of the error surface is being shaped like a bowl, so there is no risk of a local minimum.
Ordinary least-squares (OLS)
Ordinary least squares solution
Another way we can find the best fitting free parameters for linear (or linearizable nonlinear) models is to use the Ordinary Least-Squares (OLS) estimate.
In OLS, the best-fitting free parameters are found by solving a system of equations (using matrix operations/linear algebra) which leads to a closed-form solution.
This means that OLS provides exact values of the best-fitting parameters in one step (as long as a few necessary conditions are met).
OLS v. iterative optimization
We can contrast this with iterative optimization algorithms (like gradient descent) which gradually adjust the model parameters over multiple iterations to minimize the error, often requiring many steps to converge on approximate values of the best-fitting parameters.
OLS intuition
In OLS, the goal is to model the relationship between input variables and the output variable (\(y\)) as a linear combination. We express this very generally in our favorite equation, where the output (\(y\)) is a weighted sum of inputs (\(x_i\)).
\(y=\sum_{i=1}^{n}w_ix_i\)
OLS intuition
Recall that this general expression has many 🥸 aliases. That is, the linear model equation can be expressed in many ways, but they are all this same thing:
Importantly, if there are more regressors than data points, then there is no OLS solution. The intuition for the underlying math is that if there are more weights than data points, there are infinatly many solutions, all of which acheive zero error.
Constraints on OLS
We can fit if there are fewer inputs than datapoints
data2 <-tibble(y =c(2, 5, 7), x =c(1, 2, 3), z =c(2, 4, 6), a =c(6, 7, 8))(model1 <-lm(y ~1+ x, data = data2))
Call:
lm(formula = y ~ 1 + x, data = data2)

Coefficients:
(Intercept)            x
    -0.3333       2.5000
(model2 <-lm(y ~1+ x + z + a, data = data2))
Call:
lm(formula = y ~ 1 + x + z + a, data = data2)

Coefficients:
(Intercept)            x            z            a
    -0.3333       2.5000           NA           NA
Constraints on OLS
But not if there are more inputs than datapoints in our model
(model2 <-lm(y ~1+ x + z + a, data = data2))
Call:
lm(formula = y ~ 1 + x + z + a, data = data2)

Coefficients:
(Intercept)            x            z            a
    -0.3333       2.5000           NA           NA
lm() is smart and fits the reduced model it can fit. If we try to solve this the matrix way via our homegrown function, we get an error.
Let’s try it!!
Extra slides
And solve with linear algebra: \(w = (X^TX)^{-1}X^TY\)
Ordinary least squares solution in R
ols_matrix_way <-function(X, Y){solve(t(X) %*% X) %*%t(X) %*% Y }
We need to construct X and Y (must be matrices):
(response_matrix <- data %>%select(rt) %>%as.matrix())(explanatory_matrix <- data %>%mutate(int =1) %>%select(int, experience) %>%as.matrix())